. 2012 Jan 13;287(3):1932-45.
doi: 10.1074/jbc.M111.283457. Epub 2011 Nov 29.

Identification of a key motif that determines the differential surface levels of RET and TrkB tyrosine kinase receptors and controls depolarization enhanced RET surface insertion

Affiliations

Identification of a key motif that determines the differential surface levels of RET and TrkB tyrosine kinase receptors and controls depolarization enhanced RET surface insertion

Xue-Zhi Li et al. J Biol Chem. .

Abstract

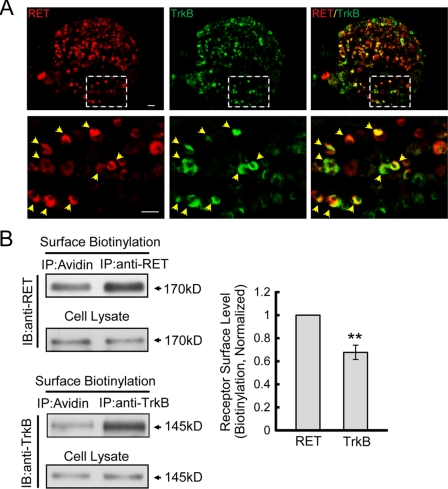
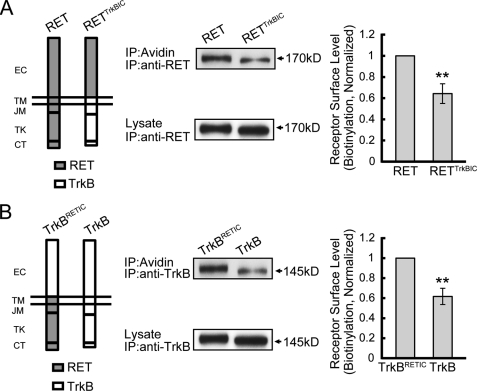
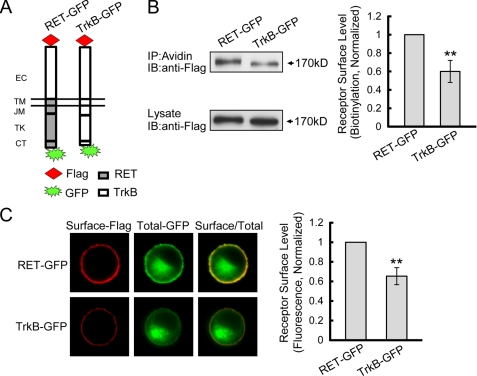
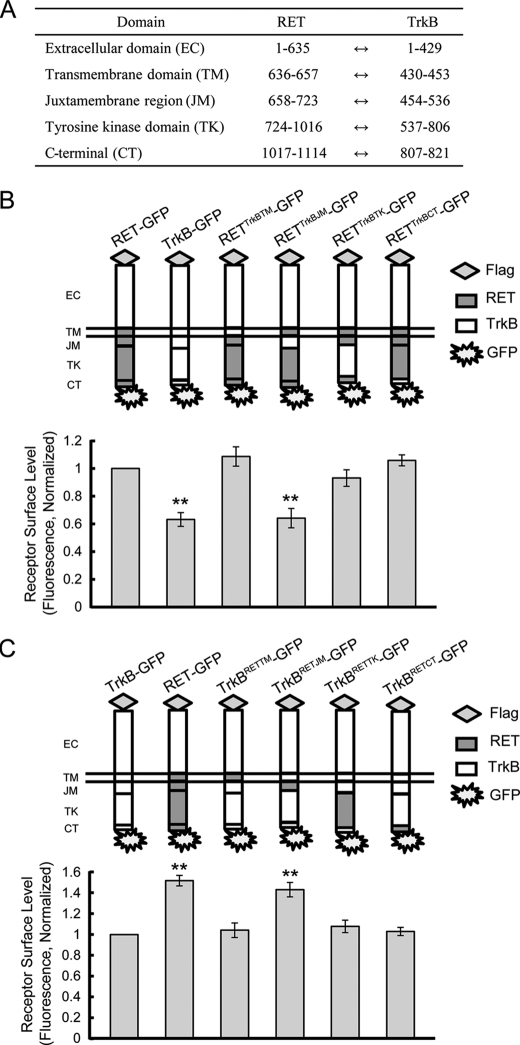
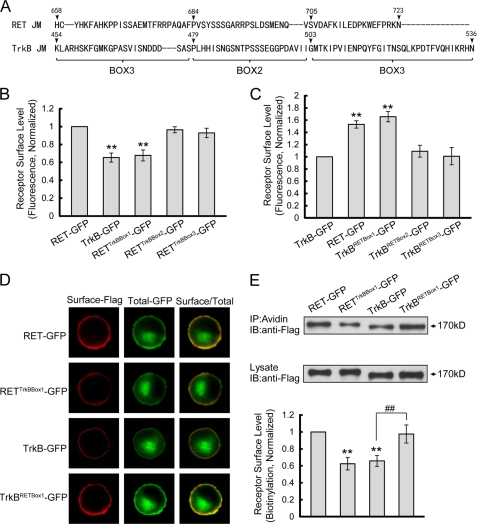
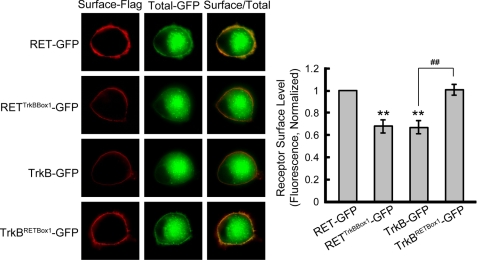
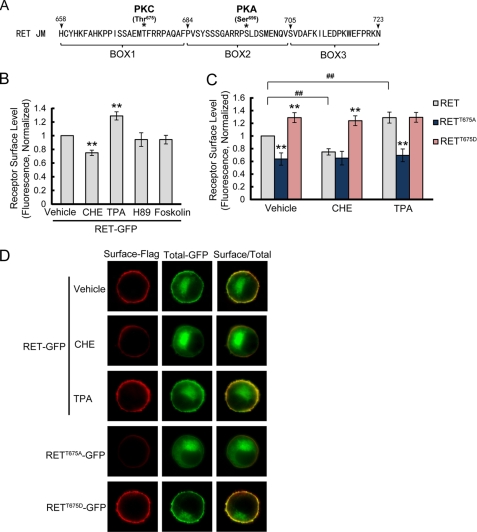
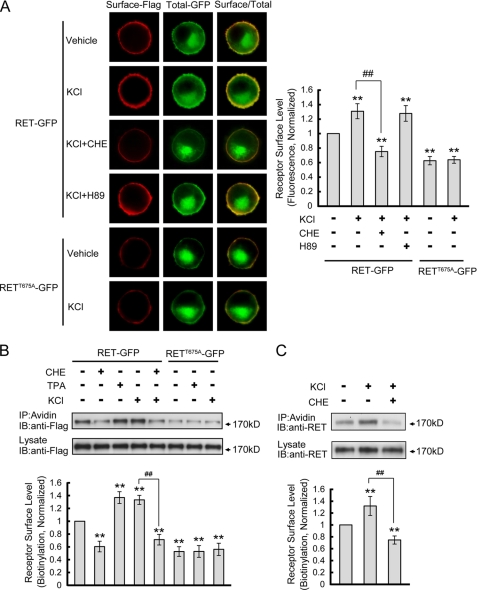
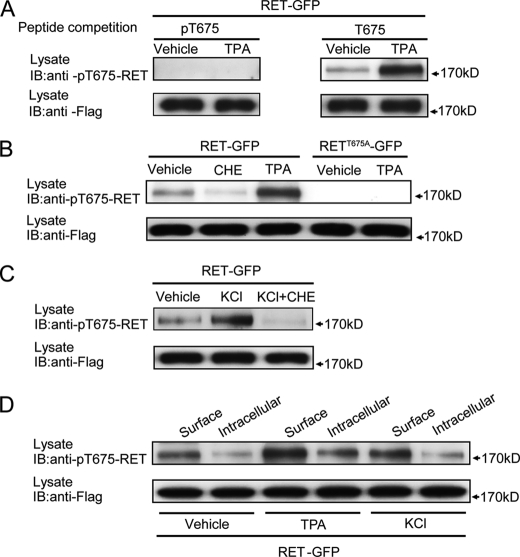
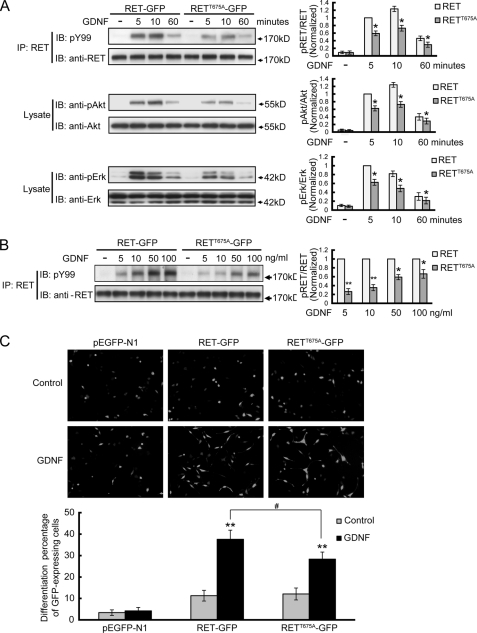
The RET tyrosine kinase receptor plays an important role in the development and maintenance of the nervous system. Although the ligand-induced RET signaling pathway has been well described, little is known about the regulation of RET surface expression, which is integral to the cell ability to control the response to ligand stimuli. We found that in dorsal root ganglion (DRG) neurons, which co-express RET and TrkB, the receptor surface levels of RET are significantly higher than that of TrkB. Using a sequence substitution strategy, we identified a key motif (Box1), which is necessary and sufficient for the differential RET and TrkB surface levels. Furthermore, pharmacological and mutagenesis assays revealed that protein kinase C (PKC) and high K(+) depolarization increase RET surface levels through phosphorylation of the Thr(675) residue in the Box1 motif. Finally, we found that the phosphorylation status of the Thr(675) residue influences RET mediated response to GDNF stimulation. In all, these findings provide a novel mechanism for the modulation of RET surface expression.


Figures

FIGURE 1.
FIGURE 1.
RET and TrkB receptors show differential cell surface levels in DRG neurons. A, immunohistochemical analysis of RET and TrkB expressions in P7 rat DRG. Lower panels show images of the dotted box at higher magnification. Co-expression is shown as red and green overlap (yellow) and indicated by yellow arrowhead. Scale bar: 10 μm. B, surface levels of RET and TrkB receptors were quantified by surface biotinylation method in cultured DRG neurons. Total RET or TrkB and their respective surface immunoprecipitates were run side by side in SDS-PAGE. Immunoreactive bands were quantified by Image J software and surface fractions are represented as surface/total ratios. Cell lysates were added as protein controls. The value of RET surface levels were arbitrarily set to 1. The results are represented as mean ± S.E. from three independent experiments (**, p < 0.01 versus RET surface levels; Student's t test).
FIGURE 2.
FIGURE 2.
The differential RET and TrkB surface levels depends on their intracellular portion. A, cell surface levels of RET and RETTrkBIC receptors were compared. RET and RETTrkBIC chimeric receptors were constructed on the pcDNA3.1 backbone and electroporated into PC12 cells. Surface proteins were collected by biotinylation methods and run on an SDS-PAGE gel. Cell lysates were added as protein level control. Immunoreactive bands were quantified by Image J software, and surface levels were represented as surface/lysate ratios. Relative receptor surface levels were normalized to that of RET. The results are represented as mean ± S.E. from three independent experiments (**, p < 0.01 versus RET surface levels; Student's t test). B, cell surface levels of TrkBRETIC and TrkB receptors were compared. TrkB and TrkBRETIC chimeric receptors were constructed on the pcDNA3.1 backbone and electroporated into PC12 cells. The same experiment process was carried out as in A. Relative receptor surface levels were normalized to that of TrkBRETIC. The results are represented as mean ± S.E. from three independent experiments (**, p < 0.01 versus TrkBRETIC surface levels; Student's t test).
FIGURE 3.
FIGURE 3.
Ratiometric fluorescence assay to measure RET and TrkB receptor surface levels. A, expression plasmids of RET and TrkB chimeras tagged with Flag epitope were constructed on the pEGFP-N1 backbone as shown. B, receptor cell surface levels were quantified by biotinylation methods in transfected PC12 cells. Immunoreactive bands were quantified by Image J software and cell surface receptor levels were represented as surface/lysate ratios. Relative receptor surface levels were normalized to that of RET-GFP. The results are represented as mean ± S.E. from three independent experiments (**, p < 0.01 versus RET surface levels; Student's t test). C, ratiometric fluorescence assay to quantify RET and TrkB receptor surface levels. PC12 cells expressing indicated receptors were stained with anti-Flag M2 antibody under unpermeabilization condition followed with Alexa Fluor 594-conjugated donkey anti-mouse IgG (red). The Alexa Fluor 594 fluorescence represented surface receptor levels, and the GFP fluorescence represented total receptor levels. Surface receptor levels were represented as the ratios of surface-Alexa Fluor 594/total-GFP fluorescence. Relative receptor surface levels were normalized to that of RET-GFP. The results are represented as mean ± S.E. from three independent experiments (**, p < 0.01 versus RET surface levels; one-way ANOVA).
FIGURE 4.
FIGURE 4.
RET juxtamembrane domain is responsible for the differential RET and TrkB surface levels. A, amino acid position of each domain based on published sequences is shown. B, surface levels of chimeric RET-GFP receptors with domain substitutions of TrkB were measured using a ratiometric fluorescence assay in transfected PC12 cells. Schematic diagrams show the structures of RET (gray) and TrkB (white) subdomains. Relative surface expression levels of each chimera were normalized to that of RET-GFP. The results are represented as mean ± S.E. from three independent experiments (**, p < 0.01 versus RET surface levels; one-way ANOVA). C, surface levels of chimeric TrkB receptors with domain substitution of RET were determined as in B. Schematic diagrams show the structures of TrkB (white) and RET (gray) subdomains. Relative surface expression levels of each chimera were normalized to that of TrkB-GFP. The results are represented as mean ± S.E. from three independent experiments (**, p < 0.01 versus TrkB surface levels; one-way ANOVA).
FIGURE 5.
FIGURE 5.
Box1 motif in RET juxtamembrane domain is necessary and sufficient for the higher RET surface levels compared with TrkB. A, sequences of the juxtamembrane regions of RET and TrkB were aligned and three motifs (Box1–3) in the juxtamembrane region were divided. B, surface levels of chimeric RET-GFP receptors with Box1–3 substitution of TrkB were measured using a ratiometric fluorescence assay in transfected PC12 cells. Relative surface levels of each chimera were normalized to that of RET-GFP. The results are represented as mean ± S.E. from three independent experiments (**, p < 0.01 versus RET surface levels; one-way ANOVA). C, surface levels of chimeric TrkB receptors with Box1–3 substitution of RET were analyzed as in B. Relative surface levels of each chimera were normalized to that of TrkB-GFP. The results are represented as mean ± S.E. from three independent experiments (**, p < 0.01 versus TrkB surface levels; one-way ANOVA). D, represented images of immunostained PC12 cells used for statistics in B and C are shown. E, chimeric receptor surface levels were quantified by biotinylation methods in transfected PC12 cells. Relative surface expression levels of each chimera were normalized to that of RET-GFP. The results are represented as mean ± S.E. from three independent experiments (**, p < 0.01 versus RET surface levels; ##, p < 0.01 versus TrkB surface levels; one-way ANOVA).
FIGURE 6.
FIGURE 6.
RET Box1 motif is necessary and sufficient for the differential RET and TrkB surface levels in DRG neurons. Cultured DRG neurons were transfected with indicated chimeric receptors. Surface levels of each chimera were measured using a ratiometric fluorescence assay and normalized to that of RET-GFP. The results are represented as mean ± S.E. from three independent experiments (**, p < 0.01 versus RET surface levels; ##, p < 0.01 versus TrkB surface levels; one-way ANOVA).
FIGURE 7.
FIGURE 7.
PKC but not PKA activation increases RET surface levels through the phosphorylation on RET Thr675 residue. A, inspection of RET Box1 sequence revealed Thr675 residue confirming the presence of a PKC phosphorylation consensus sequence. B, pharmacological treatment revealed PKC but not PKA could regulate RET cell surface levels. PC12 cells expressing RET-GFP were respectively treated with PKC inhibitor CHE for 2 h, PKC activator TPA for 30 min, PKA inhibitor H89 for 2 h or PKA activator forskolin for 30 min. Surface receptor levels were determined using a ratiometric fluorescence assay and normalized to that of vehicle-treated cells. The results are represented as mean ± S.E. from three independent experiments (**, p < 0.01 versus RET surface levels in vehicle-treated group; one-way ANOVA). C, mutagenesis of Thr675 residue affects RET surface levels and blocks the change in PKC-regulated RET surface levels. PC12 cells expressing T675A or T675D RET mutants were treated with CHE or TPA. Surface receptor levels were determined using ratiometric fluorescence assay and normalized to that of RET-GFP in vehicle-treated cells. The results are represented as mean ± S.E. from three independent experiments (**, p < 0.01 versus RET surface levels in the same group; ##, p < 0.01 versus RET surface levels in vehicle-treated group; one-way ANOVA). D, representative images of immunostained PC12 cells are shown.
FIGURE 8.
FIGURE 8.
Depolarization enhances RET cell surface levels through PKC but not PKA activation. A, PC12 cells transfected with RET-GFP or RETT675A-GFP were treated with 50 mm KCl for 30 min in the presence of various inhibitors. Receptor surface levels were determined using ratiometric fluorescence assay and normalized to that of RET-GFP in vehicle-treated cells. The results are represented as mean ± S.E. from three independent experiments (**, p < 0.01 versus RET surface levels in vehicle-treated group; ##, p < 0.01 versus RET surface levels in KCl-treated group; one-way ANOVA). B, receptor surface levels under various conditions were quantified by biotinylation methods in transfected PC12 cells. Relative receptor surface levels were normalized to that of RET-GFP in vehicle-treated cells. The results are represented as mean ± S.E. from three independent experiments (**, p < 0.01 versus RET surface levels in vehicle-treated group; ##, p < 0.01 versus RET surface levels in KCl-treated group; one-way ANOVA). C, effect of depolarization on endogenous RET surface expression was determined in cultured DRG neurons. RET cell surface levels were quantified by surface biotinylation in DRG neurons after KCl treatment with or without CHE pre-incubation. Relative RET surface levels were normalized to that of vehicle-treated neurons. The results are represented as mean ± S.E. from three independent experiments (**, p < 0.01 versus RET surface levels in vehicle-treated group; ##, p < 0.01 versus RET surface levels in KCl-treated group; one-way ANOVA).
FIGURE 9.
FIGURE 9.
RET Thr675 residue is phosphorylated by PKC and depolarization. A, specificity of the rabbit anti-pT675-RET antibody was analyzed by a peptide competition experiment. B, RET Thr675 residue was phosphorylated by PKC in transfected PC12 cells. PC12 cells expressing RET-GFP were incubated with CHE for 2 h or TPA for 30 min, and then RET phosphorylation was detected by rabbit anti-pT675-RET antibody. Phosphorylation of RETT675A-GFP after TPA treatment was measured to confirm the binding specificity of our rabbit anti-pT675-RET antibody. C, phosphorylation of RET Thr675 residue upon depolarization in transfected PC12 cells was measured. PC12 cells expressing RET-GFP were treated with 50 mm KCl for 30 min in the absence or presence of CHE pre-treatment. Phospho-Thr675 levels were analyzed by Western blot. D, cell surface RET was preferentially phosphorylated on Thr675 compared with cytoplasmic RET. After incubation with TPA or KCl for 30 min, surface and cytoplasmic RET proteins in transfected PC12 cells were respectively collected. Thr675 phosphorylation levels were examined in surface or cytoplasmic RET fraction from vehicle, TPA, or KCl groups.
FIGURE 10.
FIGURE 10.
RET Thr675 residue regulates ligand-induced RET signaling and cell differentiation. A, analysis of the signal transduction mediated by RETT675A receptor in response to GDNF stimulation. PC12 cells were transfected with GFP fused RET or RETT675A and stimulated with 50 ng/ml GDNF for 5, 10 or 60 min. Immunoprecipitates or cell lysates were analyzed with the indicated antibodies. The levels of phospho-RET, phospho-Akt, and phospho-Erk1/2 were represented as the ratios of phosphoprotein over total protein. The histogram shows the phosphorylation levels of RET, Akt or Erk1/2 from three independent experiments normalized to their respective 5 min RET group. The results are represented as mean ± S.E. from three independent experiments (*, p < 0.05 versus their respective RET group; Student's t test). B, analysis of RET and RETT675A activation in response to different GDNF concentrations. PC12 cells were transfected with GFP-fused RET or RETT675A and stimulated by different GDNF concentrations. The levels of phospho-RET were represented as the ratios of phospho-RET versus total RET. At each GDNF concentration, phosphorylation levels of RETT675A were normalized to that of RET. The results are represented as mean ± S.E. from three independent experiments (*, p < 0.05, **, p < 0.01 versus their respective RET group; Student's t test). C, GDNF induced differentiation of PC12 cells expressing GFP fused RET or RETT675A. PC12 cells transfected with the indicated constructs were stimulated with 50 ng/ml GDNF for 3 days. Cells displaying neurite extension longer than twice the cell diameter were counted as differentiated cells. The results were normalized to the total number of transfected (GFP-positive) PC12 cells in each field. All of the GDNF stimulations were supplemented with 300 ng/ml soluble GFRα1. The results are represented as mean ± S.E. from three independent experiments (**, p < 0.01 versus their respective control group; #, p < 0.05 versus GDNF-treated RET group; one-way ANOVA).

Similar articles

Cited by

References

    1. Schuchardt A., D'Agati V., Larsson-Blomberg L., Costantini F., Pachnis V. (1994) Defects in the kidney and enteric nervous system of mice lacking the tyrosine kinase receptor Ret. Nature 367, 380–383 - PubMed
    1. Baloh R. H., Enomoto H., Johnson E. M., Jr., Milbrandt J. (2000) The GDNF family ligands and receptors - implications for neural development. Curr. Opin. Neurobiol. 10, 103–110 - PubMed
    1. Airaksinen M. S., Saarma M. (2002) The GDNF family: signaling, biological functions, and therapeutic value. Nat. Rev. Neurosci. 3, 383–394 - PubMed
    1. Molliver D. C., Wright D. E., Leitner M. L., Parsadanian A. S., Doster K., Wen D., Yan Q., Snider W. D. (1997) IB4-binding DRG neurons switch from NGF to GDNF dependence in early postnatal life. Neuron 19, 849–861 - PubMed
    1. Honma Y., Kawano M., Kohsaka S., Ogawa M. (2010) Axonal projections of mechanoreceptive dorsal root ganglion neurons depend on Ret. Development 137, 2319–2328 - PubMed

Publication types

MeSH terms