. 2012 Jan 20;287(4):2544-57.
doi: 10.1074/jbc.M111.275354. Epub 2011 Nov 28.

The C terminus of Bax inhibitor-1 forms a Ca2+-permeable channel pore

Affiliations

The C terminus of Bax inhibitor-1 forms a Ca2+-permeable channel pore

Geert Bultynck et al. J Biol Chem. .

Abstract

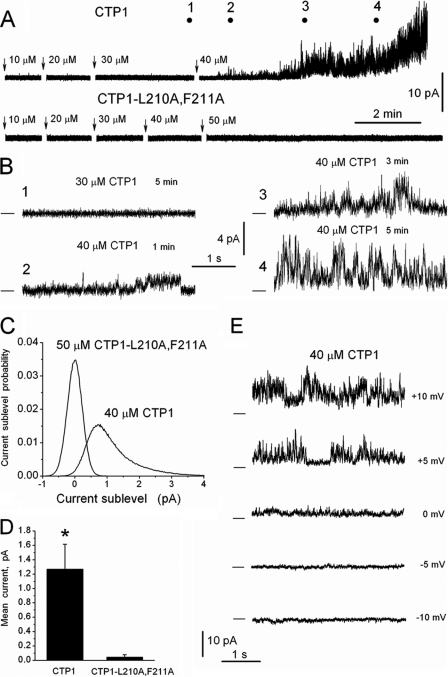
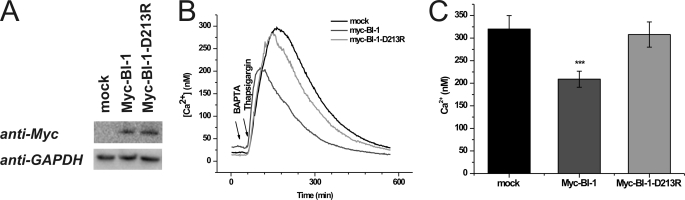
Bax inhibitor-1 (BI-1) is a multitransmembrane domain-spanning endoplasmic reticulum (ER)-located protein that is evolutionarily conserved and protects against apoptosis and ER stress. Furthermore, BI-1 is proposed to modulate ER Ca(2+) homeostasis by acting as a Ca(2+)-leak channel. Based on experimental determination of the BI-1 topology, we propose that its C terminus forms a Ca(2+) pore responsible for its Ca(2+)-leak properties. We utilized a set of C-terminal peptides to screen for Ca(2+) leak activity in unidirectional (45)Ca(2+)-flux experiments and identified an α-helical 20-amino acid peptide causing Ca(2+) leak from the ER. The Ca(2+) leak was independent of endogenous ER Ca(2+)-release channels or other Ca(2+)-leak mechanisms, namely translocons and presenilins. The Ca(2+)-permeating property of the peptide was confirmed in lipid-bilayer experiments. Using mutant peptides, we identified critical residues responsible for the Ca(2+)-leak properties of this BI-1 peptide, including a series of critical negatively charged aspartate residues. Using peptides corresponding to the equivalent BI-1 domain from various organisms, we found that the Ca(2+)-leak properties were conserved among animal, but not plant and yeast orthologs. By mutating one of the critical aspartate residues in the proposed Ca(2+)-channel pore in full-length BI-1, we found that Asp-213 was essential for BI-1-dependent ER Ca(2+) leak. Thus, we elucidated residues critically important for BI-1-mediated Ca(2+) leak and its potential channel pore. Remarkably, one of these residues was not conserved among plant and yeast BI-1 orthologs, indicating that the ER Ca(2+)-leak properties of BI-1 are an added function during evolution.


Figures

FIGURE 1.
FIGURE 1.
BI-1 contains six transmembrane domains and a C-terminal loop domain. A, bioinformatical prediction of the topology of BI-1 in the ER membrane according to TMpred and TMHMM. The arrowhead in model B indicates the beginning of the C-terminal region of BI-1, including the CTP1, CTP2, and pH-sensor domains. B, amino acid-sequence of the BI-1 C terminus according to model B, indicating CTP1, CTP2, a potential loop domain with homology to SCN5A (indicated in blue), and the C terminus according to model A (indicated in red). Mapped interacting sites are indicated. C, selective permeabilization of the plasma membrane allows staining of HA-BI-1 and BI-1-HA but not of luminal ERp44. N2a cells were transiently transfected with the indicated plasmids and permeabilized with digitonin, which only permeabilizes the plasma membrane, or Triton X-100, which permeabilizes all cellular membranes. Cells were then stained with an FITC-labeled anti-HA antibody and fluorescence was quantitated by flow cytometry as shown in the representative plots. Bar graphs represent mean ± S.E. of six pooled independent experiments done in triplicates.
FIGURE 2.
FIGURE 2.
A peptide derived from the C-terminal end of BI-1 (CTP1), corresponding to amino acids 198–217 induces Ca2+ release from the ER. A, permeabilized MEF cells loaded to steady-state with 45Ca2+ were incubated in Ca2+-free efflux medium and their Ca2+ content, expressed in counts per min (cpm), monitored as a function of time. In the time period indicated by the line, vehicle, CTP1, and CTP2 were added for 8 min. CTP1, but not CTP2, led to a decrease in the Ca2+ content. B, results obtained from the experiment described in A were plotted as “fractional loss” (%/2 min) as a function of time. CTP1, but not vehicle or CTP2, provoked an increase in the fractional loss. C, different concentrations of CTP1 were added during the efflux phase for 6 min. Results were plotted as fractional loss as a function of time. D, CTP1-induced Ca2+ release from 45Ca2+-loaded permeabilized cells was quantified as the difference in fractional loss between 2 min after application of CTP1 and before CTP1, i.e. the fractional loss at 10 min minus the fractional loss at 8 min. Concentration-response curve for CTP1-induced Ca2+ release was obtained from three independent experiments. All results were normalized to the Ca2+ released by the Ca2+ ionophore, A23187, and expressed as % of total A23187-induced Ca2+ release.
FIGURE 3.
FIGURE 3.
CTP1-induced Ca2+ release is independent of BI-1, IP3Rs, RyRs, presenilins, and translocon. A, CTP1-induced Ca2+ release from 45Ca2+-loaded permeabilized wild-type and BI-1−/− MEF cells. CTP1 (40 μm) was added during the efflux as indicated. B, CTP1-induced Ca2+ release from 45Ca2+-loaded permeabilized MEF cells in the presence of inhibitors of the IP3R (100 μm 2-aminoethoxydiphenyl borate (2-APB)), the RyR (100 μm ryanodine), and the translocon (100 μm anisomycin). C, CTP1-induced Ca2+ release from 45Ca2+-loaded permeabilized PS1−/− PS2−/− MEF cells (PS, presenilin). Different concentrations of CTP1 were added during the efflux as indicated. D, CTP1-induced Ca2+ release from 45Ca2+-loaded permeabilized Lvec and IP3R1-overexpressing L15 fibroblasts. E and F, CTP1-induced Ca2+ release from Mag-Fluo4-loaded ER of permeabilized DT40 TKO cells and TKO cells ectopically expressing IP3R1. The MagFluo4 signal monitored over time is related to the [Ca2+]ER. Ca2+ uptake in the ER is initiated by addition of ATP. After reaching steady-state, thapsigargin was added to follow unidirectional Ca2+ flux from the ER. After 90 s, different concentrations of CTP1 were added. Ionomycin (10 μm) was added to determine the maximal releasable Ca2+. The vehicle (DMSO, dimethyl sulfoxide) was added to determine the passive Ca2+ leak.
FIGURE 4.
FIGURE 4.
CTP1-induced Ca2+ release originates from the IP3-sensitive store. A, CTP1-induced Ca2+ release from 45Ca2+-loaded permeabilized MEF cells was measured without (■) and with (●) preincubation of a supramaximal concentration of IP3 (50 μm). B, CTP1-induced Ca2+ release, provoked by different concentrations of CTP1, was quantified relative to a supramaximal concentration of IP3 (50 μm). The maximal CTP1-induced Ca2+ release amounted to about 80% of the Ca2+ release provoked by a saturating concentration of IP3.
FIGURE 5.
FIGURE 5.
CTP1-induced Ca2+ release depends on hydrophobic residues Leu-210 and Phe-211 and on its α-helical properties. A, 45Ca2+ release from permeabilized MEF cells provoked by CTP1 and its truncated forms. Truncated forms of CTP1 did not provoke Ca2+ release from the ER. A representative experiment is shown for 3 independent experiments. B, I-TASSER predictions for CTP1, CTP1-L210A,F211A, CTP1-L210G,F211G, CTP1-C207G,I208G, and CTP1-C207A. C, a plot showing the hydrophobicity score of the CTP1 and the different mutants following the Kyte-Doolittle model (50). Positive values indicate higher hydrophobicity, whereas negative values indicate higher hydrophilicity. D, Ca2+ release from permeabilized MEF cells provoked by CTP1 and mutant forms. A representative experiment is shown for 4 independent experiments. DMSO, dimethyl sulfoxide.
FIGURE 6.
FIGURE 6.
CTP1 displays ion channel-like activity in planar lipid bilayers. A, traces of currents from two representative experiments attempting incorporation of the CTP1 (top) and CTP1-L210A,F211A (bottom) peptides into the artificial lipid bilayers. The peptide-concentration increments are indicated by arrows. Breaks within traces correspond to 1-min cis chamber solution stirring intervals after peptide additions. B, higher resolution (4-s long) fragments of the CTP1-generated currents at the time points corresponded to the numbered circles in A. C, current sublevel-probability histograms obtained from continuous 60-s long fragments of traces presented in A during the first minute of the channel activity appearance for CTP1 (40 μm) and during prolonged incubation with CTP1-L210A,F211A (50 μm). D, values of the mean current (Imean ± S.E.) calculated from 60-s long recordings and averaged for four experiments for each peptide. For CTP1, the 60-s recordings were taken immediately after appearance of the initial series of spikes indicating formation of the CTP1-assembled channels (*, p < 0.05). E, representative 4-s long recordings obtained at various membrane potentials (shown on the right) from the same planar lipid bilayer within an interval of quasistable basal current carried by CTP1-induced (40 μm) ion channels in asymmetric bilayer ionic conditions (cis, HEPES/Tris; trans, HEPES/Ba2+, 50 mm, see ”Experimental Procedures“).
FIGURE 7.
FIGURE 7.
CTP1 peptides corresponding to sequences of animal orthologs of BI-1, but not plant and yeast orthologs, provoked Ca2+ release. A, amino acid sequence of different animal and plant BI-1 orthologs. B, application of 40 μm CTP1 peptides corresponding to different animal, plant, and yeast orthologs of BI-1 during the efflux phase of 45Ca2+-loaded permeabilized MEF cells.
FIGURE 8.
FIGURE 8.
Asp-209 and Asp-213 are essential residues of the Ca2+-channel pore of CTP1. A, double Asp/Arg mutants of CTP1 and CTP1-D213R were not able to provoke 45Ca2+ mobilization from the ER of permeabilized MEF cells. A typical experiment, representative for three independent experiments, is shown. B, mutation of each of the four Asp residues into Ala in the CTP1 peptide reveals a critical role for Asp-209 and Asp-213. CTP1-D209T represents the change in Asp residues between animal and plant CTP1 orthologs. A typical experiment, representative for four independent experiments, is shown. C, quantification of the amount of Ca2+ released by CTP1 and its respective aspartate mutations.
FIGURE 9.
FIGURE 9.
Asp-213 is essential for the function of full-length BI-1. A, Western blot analysis using anti-Myc antibodies showing the expression of Myc-BI-1 and Myc-BI-1-D213R in HeLa cell lysates. B, representative Ca2+ signals obtained from calibrated Fura-2-loaded HeLa cells co-transfected with mCherry plasmid and mock (plasmid only), myc-BI-1, and myc-BI-1-D213R, respectively. C, mean maximal peak height of Ca2+ signals (n = 61 to 68, five biological replicates). Two-tailed t test shows significant difference between mock- and myc-BI-1 (p < 0.005) as well as myc-BI-1 and myc-BI-1-D213R-transfected cells (p < 0.005), but not between mock- and BI-1-D213R-transfected cells (p = 0.80).

Similar articles

Cited by

References

    1. Sammels E., Parys J. B., Missiaen L., De Smedt H., Bultynck G. (2010) Intracellular Ca2+ storage in health and disease. A dynamic equilibrium. Cell Calcium 47, 297–314 - PubMed
    1. Berridge M. J., Bootman M. D., Roderick H. L. (2003) Calcium signaling. Dynamics, homeostasis, and remodeling. Nat. Rev. Mol. Cell Biol. 4, 517–529 - PubMed
    1. Madeo F., Kroemer G. (2009) Intricate links between ER stress and apoptosis. Mol. Cell 33, 669–670 - PubMed
    1. Austin R. C. (2009) The unfolded protein response in health and disease. Antioxid. Redox Signal. 11, 2279–2287 - PubMed
    1. D'hondt C., Ponsaerts R., De Smedt H., Vinken M., De Vuyst E., De Bock M., Wang N., Rogiers V., Leybaert L., Himpens B., Bultynck G. (2011) Pannexin channels in ATP release and beyond. An unexpected rendezvous at the endoplasmic reticulum. Cell Signal. 23, 305–316 - PubMed

Publication types

MeSH terms