. 2012 Jan 20;287(4):2766-76.
doi: 10.1074/jbc.M111.281782. Epub 2011 Nov 29.

Insulin-like growth factor-I receptor (IGF-IR) translocates to nucleus and autoregulates IGF-IR gene expression in breast cancer cells

Affiliations

Insulin-like growth factor-I receptor (IGF-IR) translocates to nucleus and autoregulates IGF-IR gene expression in breast cancer cells

Rive Sarfstein et al. J Biol Chem. .

Abstract

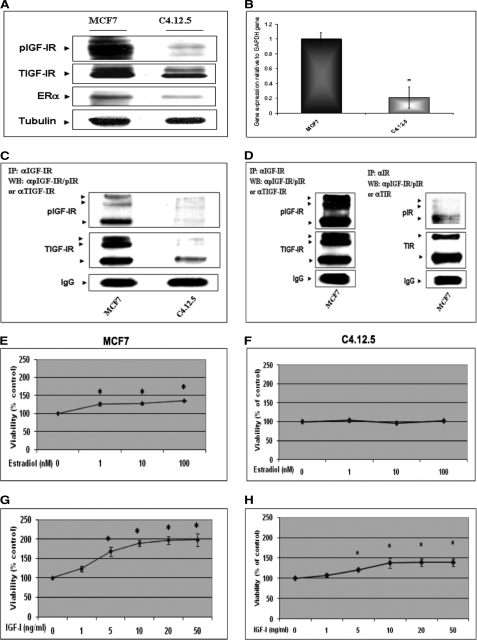
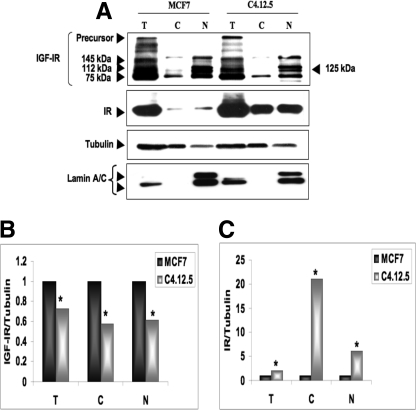
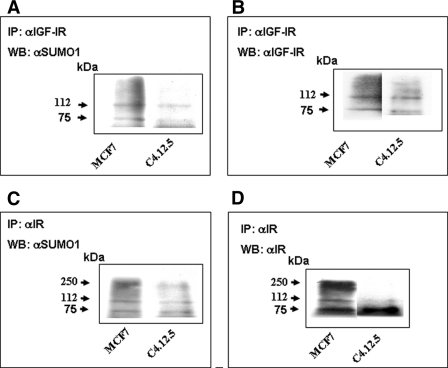
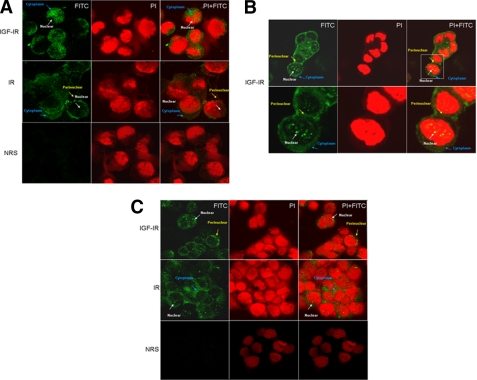
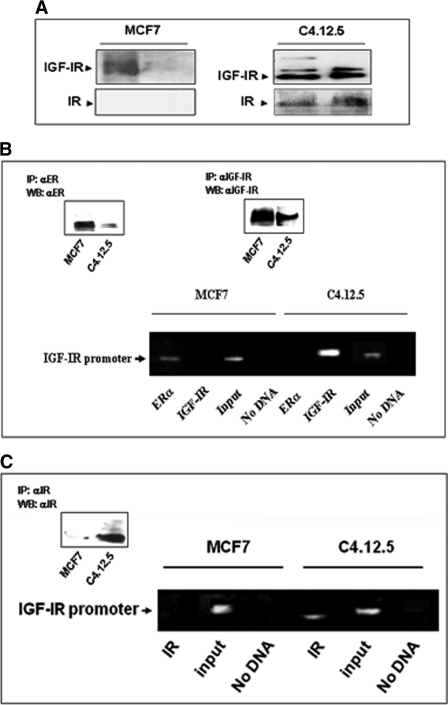
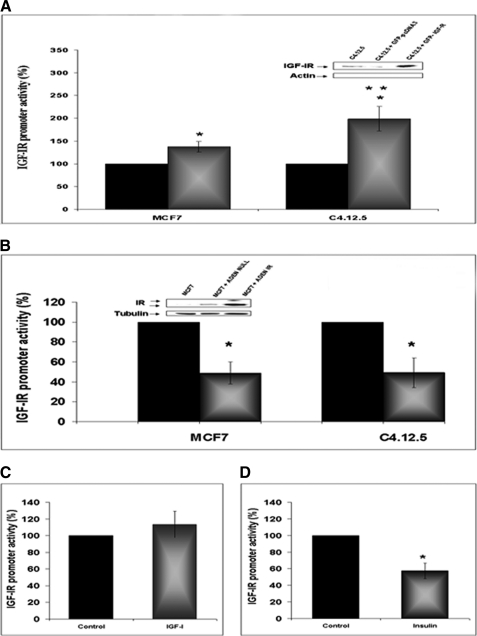
The insulin-like growth factor (IGF) system plays an important role in mammary gland biology as well as in the etiology of breast cancer. The IGF-I receptor (IGF-IR), which mediates the biological actions of IGF-I and IGF-II, has emerged in recent years as a promising therapeutic target. The IGF and estrogen signaling pathways act in a synergistic manner in breast epithelial cells. The present study was aimed at investigating 1) the putative translocation of IGF-IR and the related insulin receptor (IR) to the nucleus in breast cancer cells, 2) the impact of IGF-IR and IR levels on IGF-IR biosynthesis in estrogen receptor (ER)-positive and ER-depleted breast cancer cells, and 3) the potential transcription factor role of IGF-IR in the specific context of IGF-IR gene regulation. We describe here a novel mechanism of autoregulation of IGF-IR gene expression by cellular IGF-IR, which is seemingly dependent on ER status. Regulation of the IGF-IR gene by IGF-IR protein is mediated at the level of transcription, as demonstrated by 1) binding assays (DNA affinity chromatography and ChIP) showing specific IGF-IR binding to IGF-IR promoter DNA and 2) transient transfection assays showing transactivation of the IGF-IR promoter by exogenous IGF-IR. The IR is also capable of translocating to the nucleus and binding the IGF-IR promoter in ER-depleted, but not in ER-positive, cells. However, transcription factors IGF-IR and IR display diametrically opposite activities in the context of IGF-IR gene regulation. Thus, whereas IGF-IR stimulated IGF-IR gene expression, IR inhibited IGF-IR promoter activity. In summary, we have identified a novel mechanism of IGF-IR gene autoregulation in breast cancer cells. The clinical implications of these findings and, in particular, the impact of IGF-IR/IR nuclear localization on targeted therapy require further investigation.


Figures

FIGURE 1.
FIGURE 1.
IGF-IR gene expression in ER-positive and ER-depleted breast cancer cells. A, Western blot analysis of IGF-IR levels. MCF7 and C4.12.5 cell lines were lysed in the presence of protease inhibitors, and equal amounts of protein (100 μg) were separated by 10% SDS-PAGE. After electrophoresis, proteins were transferred onto nitrocellulose membranes and blotted with antibodies against total and phosphorylated IGF-IR (pIGF-IR) and ERα, followed by incubation with an HRP-conjugated secondary antibody. Membranes were reprobed with a tubulin antibody. The figure shows the results of a typical experiment, repeated multiple times with similar results. B, quantitative real-time PCR of IGF-IR mRNA levels. Total RNA was prepared from MCF7 and C4.12.5 cells, and IGF-IR mRNA and GAPDH mRNA values were measured using the TaqMan® real-time PCR system. Analysis of the data was performed as described under “Experimental Procedures.” *, p < 0.01 versus MCF7 cells. C and D, IP analysis of phospho-IGF-IR and phospho-IR abundance in MCF7 and C4.12.5 cells. Total cell extracts (650 μg) were immunoprecipitated with antibodies against total IGF-IR or total-IR, electrophoresed, and immunoblotted with antibodies against phospho-IGF-IR/IR, total IGF-IR, or total-IR. Exposure time for the autoradiogram shown in C was 1 min, whereas the autoradiogram shown in D was exposed for 1 h. E–H, mitogenic effects of estradiol and IGF-I in MCF7 and C4.12.5 cells. MCF7 and C4.12.5 cells were starved overnight and then incubated with increasing doses of estradiol (1, 10, and 100 nm) or IGF-I (1, 5, 10, 20, and 50 ng/ml) for 72 h in serum-free medium. Cellular proliferation was assessed by 3-(4,5-dimethylthiazol-2-yl)-2,5-diphenyltetrazolium bromide assays. p < 0.05 versus control cells. A value of 100% was given to the number of cells in control (unstimulated) cultures. Error bars, S.E.
FIGURE 2.
FIGURE 2.
Subcellular distribution of IGF-IR in MCF7 and C4.12.5 cells. A, confluent MCF7 and C4.12.5 cells were lysed and fractionated into cytosolic and nuclear fractions, as described under “Experimental Procedures.” Total lysates (T; 80 μg) and cytosolic (C; 20 μg) and nuclear fractions (N; 20 μg) were resolved on 10% SDS-PAGE and blotted with anti-IGF-IR, anti-IR, anti-tubulin, and anti-lamin A/C (as a control for contamination of cytosolic fractions). Quantitative analysis of IGF-IR (B) and IR (C) abundance in MCF7 and C4.12.5 cells was done by scanning densitometry of the corresponding bands. The bars represent the mean ± S.E. of three independent experiments. p < 0.01 versus MCF7 cells.
FIGURE 3.
FIGURE 3.
Coimmunoprecipitation analysis of IGF-IR and IR SUMOylation. Nuclear extracts of MCF7 and C4.12.5 (35 μg) were immunoprecipitated (IP) with anti-IGF-IR or anti-IR, electrophoresed through 10% SDS-polyacrylamide gels, and immunoblotted (WB) with anti-SUMO-1 (A and C) as described under “Experimental Procedures.” Membranes were reprobed with IGF-IR (B) or IR (D) antibodies.
FIGURE 4.
FIGURE 4.
Confocal microscopy analysis of IGF-IR nuclear localization. A, fluorescence microscope imaging of IGF-IR and IR-expressing MCF7 cells by confocal immunofluorescence microscopy. B, amplified fluorescence imaging of IGF-IR-expressing MCF7 cells. C, fluorescence microscope imaging of IGF-IR- and IR-expressing C4.12.5 cells. Fixed cells were stained for DNA with PI (red) and for IGF-IR and IR with fluorescent goat anti-rabbit IgG (FITC) (green). Merging of pictures (FITC + PI) gives a yellow color with yellow grains in the nucleus. NRS was used as a negative control (A and C).
FIGURE 5.
FIGURE 5.
Binding of IGF-IR and IR to IGF-IR promoter DNA. A, DNA affinity chromatography. Nuclear extracts of MCF7 and C4.12.5 cells were incubated with a PCR-amplified, biotin-labeled IGF-IR proximal promoter DNA probe extending from nt −458 to +53, after which DNA-protein complexes were adsorbed to streptavidin beads. Bound proteins were eluted with a high salt buffer, electrophoresed through 10% SDS-PAGE, and blotted with antibodies against IGF-IR or IR β-subunits. The left lanes in each gel correspond to nuclear extracts, and the right lanes represent the DNA affinity chromatography eluates. B and C, chromatin immunoprecipitation. MCF7 and C4.12.5 cells were cross-linked with formaldehyde, lysed, sonicated, and immunoprecipitated with IGF-IR (B), IR (C), or ERα (B) antibodies, followed by PCR amplification of precipitated chromatin using primers encompassing the IGF-IR promoter. The position of the 510-bp amplified fragments is indicated. The input bands represent the amplified PCR product in the absence of antibodies. Immunoprecipitated (IP) IGF-IR, IR, and ER were detected by Western blots (WB) using specific antibodies (insets).
FIGURE 6.
FIGURE 6.
Effect of IGF-IR and IR levels on IGF-IR promoter activity. A, MCF7 and C4.12.5 cells were cotransfected with the p(−188/+640)LUC IGF-IR reporter construct, along with a full-length IGF-IR cDNA expression vector (GFP-IGF-IR) (or empty pcDNA3) and a β-galactosidase vector. Forty-eight hours after transfection, cells were harvested and luciferase and β-galactosidase activities were measured. Promoter activities are expressed as luciferase values normalized to β-gal values. A value of 100% was given to the promoter activity generated by the reporter plasmid in empty vector-transfected MCF7 or C4.12.5 cells. Bars, mean ± S.E. (error bars) of three independent experiments in duplicate wells. *, p < 0.05 versus control cells; **, p < 0.05 versus MCF7 cells transfected with GFP-IGF-IR. The inset shows a Western blot (WB) of C4.12.5 cells transfected with GFP-IGF-IR or GFP-pcDNA in comparison with endogenous IGF-IR expression. B, MCF7 and C4.12.5 cells were infected with an IR-containing adenoviral vector (or empty virus). After 24 h, the medium was changed, and cells were transfected with the p(−188/+640)LUC IGF-IR reporter construct for 48 h. Bars, mean ± S.E. of three independent experiments in duplicate wells. *, p < 0.01 versus control cells. The inset shows a Western blot using a specific IR antibody of MCF7 cells infected with the IR viral vector or empty vector in comparison with endogenous IR expression. C and D, MCF7 cells were transfected with the p(−188/+640)LUC IGF-IR promoter plasmid along with the full-length IGF-IR (C) or IR (D) vectors described above, in serum-containing medium. After 24 h, medium was replaced with serum-free medium, and cells were incubated for an additional 24 h in the presence of 50 ng/ml of IGF-I (C) or insulin (D) (or left untreated). After an additional 24 h, cells were harvested, and luciferase and β-galactosidase activities were measured as described above. A value of 100% was given to the promoter activities of expression vector-transfected cells in the absence of exogenous ligand treatments; *, p < 0.05 versus control cells.

References

    1. Rowzee A. M., Lazzarino D. A., Rota L., Sun Z., Wood T. L. (2008) IGF ligand and receptor regulation of mammary development. J. Mammary Gland Biol. Neoplasia 13, 361–370 - PMC - PubMed
    1. Werner H., Le Roith D. (2000) New concepts in regulation and function of the insulin-like growth factors. Implications for understanding normal growth and neoplasia. Cell Mol. Life Sci. 57, 932–942 - PMC - PubMed
    1. Surmacz E. (2000) Function of the IGF-I receptor in breast cancer. J. Mammary Gland Biol. Neoplasia 5, 95–105 - PubMed
    1. Chitnis M. M., Yuen J. S., Protheroe A. S., Pollak M., Macaulay V. M. (2008) The type 1 insulin-like growth factor receptor pathway. Clin. Cancer Res. 14, 6364–6370 - PubMed
    1. Werner H., Bruchim I. (2009) The insulin-like growth factor-I receptor as an oncogene. Arch. Physiol. Biochem. 115, 58–71 - PubMed

MeSH terms