

Segmentation and intensity estimation for microarray images with saturated pixels
- PMID: 22129216
- PMCID: PMC3269438
- DOI: 10.1186/1471-2105-12-462
Segmentation and intensity estimation for microarray images with saturated pixels
Abstract
Background: Microarray image analysis processes scanned digital images of hybridized arrays to produce the input spot-level data for downstream analysis, so it can have a potentially large impact on those and subsequent analysis. Signal saturation is an optical effect that occurs when some pixel values for highly expressed genes or peptides exceed the upper detection threshold of the scanner software (2(16) - 1 = 65, 535 for 16-bit images). In practice, spots with a sizable number of saturated pixels are often flagged and discarded. Alternatively, the saturated values are used without adjustments for estimating spot intensities. The resulting expression data tend to be biased downwards and can distort high-level analysis that relies on these data. Hence, it is crucial to effectively correct for signal saturation.
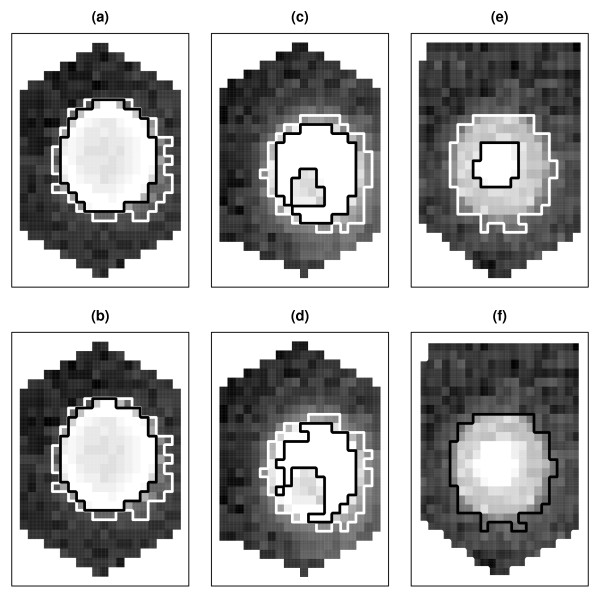
Results: We developed a flexible mixture model-based segmentation and spot intensity estimation procedure that accounts for saturated pixels by incorporating a censored component in the mixture model. As demonstrated with biological data and simulation, our method extends the dynamic range of expression data beyond the saturation threshold and is effective in correcting saturation-induced bias when the lost information is not tremendous. We further illustrate the impact of image processing on downstream classification, showing that the proposed method can increase diagnostic accuracy using data from a lymphoma cancer diagnosis study.
Conclusions: The presented method adjusts for signal saturation at the segmentation stage that identifies a pixel as part of the foreground, background or other. The cluster membership of a pixel can be altered versus treating saturated values as truly observed. Thus, the resulting spot intensity estimates may be more accurate than those obtained from existing methods that correct for saturation based on already segmented data. As a model-based segmentation method, our procedure is able to identify inner holes, fuzzy edges and blank spots that are common in microarray images. The approach is independent of microarray platform and applicable to both single- and dual-channel microarrays.
Figures


Similar articles
-
Correcting log ratios for signal saturation in cDNA microarrays.Bioinformatics. 2004 Nov 1;20(16):2685-93. doi: 10.1093/bioinformatics/bth309. Epub 2004 May 14. Bioinformatics. 2004. PMID: 15145811
-
Segmentation and intensity estimation of microarray images using a gamma-t mixture model.Bioinformatics. 2007 Feb 15;23(4):458-65. doi: 10.1093/bioinformatics/btl630. Epub 2006 Dec 12. Bioinformatics. 2007. PMID: 17166856
-
Bayesian hierarchical model for correcting signal saturation in microarrays using pixel intensities.Stat Appl Genet Mol Biol. 2006;5:Article20. doi: 10.2202/1544-6115.1220. Epub 2006 Aug 28. Stat Appl Genet Mol Biol. 2006. PMID: 17049031
-
Methods in quantitative image analysis.Histochem Cell Biol. 1996 May;105(5):333-55. doi: 10.1007/BF01463655. Histochem Cell Biol. 1996. PMID: 8781988 Review.
-
Analysis of cDNA microarray images.Brief Bioinform. 2001 Dec;2(4):341-9. doi: 10.1093/bib/2.4.341. Brief Bioinform. 2001. PMID: 11808746 Review.
Cited by
-
Review of In Situ Hybridization (ISH) Stain Images Using Computational Techniques.Diagnostics (Basel). 2024 Sep 21;14(18):2089. doi: 10.3390/diagnostics14182089. Diagnostics (Basel). 2024. PMID: 39335767 Free PMC article. Review.
-
Mechanisms and Minimization of False Discovery of Metabolic Bioorthogonal Noncanonical Amino Acid Proteomics.Rejuvenation Res. 2022 Apr;25(2):95-109. doi: 10.1089/rej.2022.0019. Rejuvenation Res. 2022. PMID: 35323026 Free PMC article.
-
Unsupervised image segmentation for microarray spots with irregular contours and inner holes.BMC Bioinformatics. 2015 Dec 23;16:412. doi: 10.1186/s12859-015-0842-3. BMC Bioinformatics. 2015. PMID: 26698293 Free PMC article.
-
Multi-Biometric System Based on Cutting-Edge Equipment for Experimental Contactless Verification.Sensors (Basel). 2019 Aug 26;19(17):3709. doi: 10.3390/s19173709. Sensors (Basel). 2019. PMID: 31455045 Free PMC article.
References
-
- Hsiao LL, Jensen RV, Yoshida T, Clark KE, Blumenstock JE, Gullans SR. Correcting for signal saturation errors in the analysis of microarray data. BioTechniques. 2002;32:330–336. - PubMed
-
- Garcia de la Nava J, van Hijum S, Trelles O. Saturation and quantization reduction in microarray experiments using two scans at different sensitivities. Statistical Applications in Genetics and Molecular Biology. 2004;3:Article 11. - PubMed
Publication types
MeSH terms
LinkOut - more resources
Full Text Sources
Other Literature Sources
Molecular Biology Databases
Research Materials
