. 2012;75(2):112-28.
doi: 10.1080/15287394.2011.615110.

Cell permeability, migration, and reactive oxygen species induced by multiwalled carbon nanotubes in human microvascular endothelial cells

Affiliations

Cell permeability, migration, and reactive oxygen species induced by multiwalled carbon nanotubes in human microvascular endothelial cells

M Pacurari et al. J Toxicol Environ Health A. 2012.

Abstract

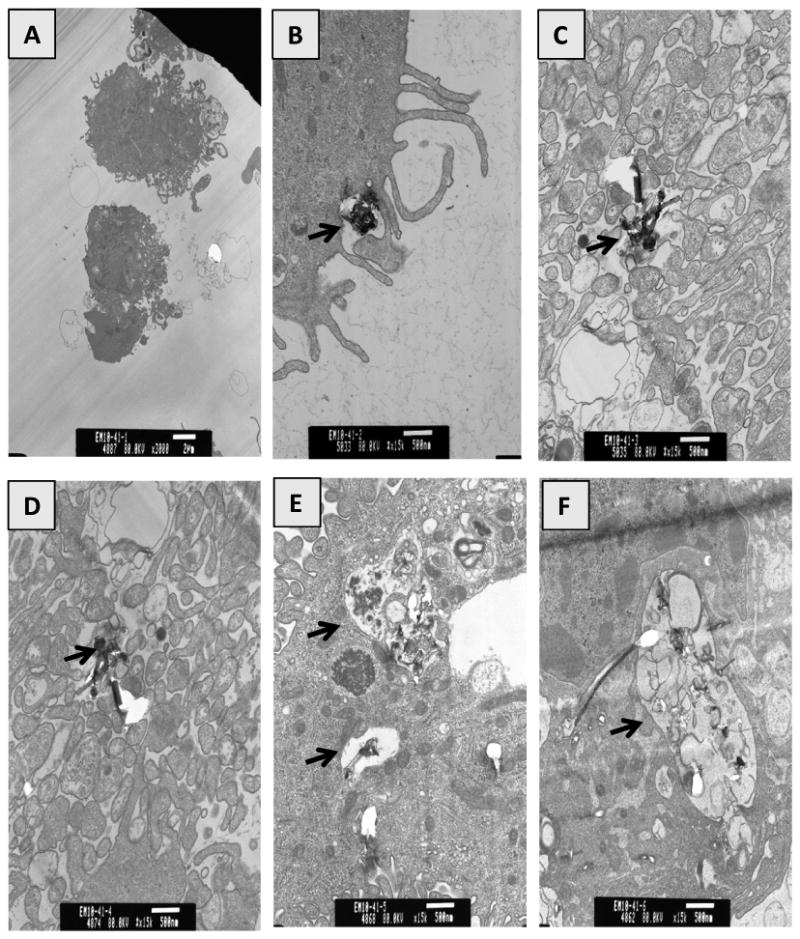
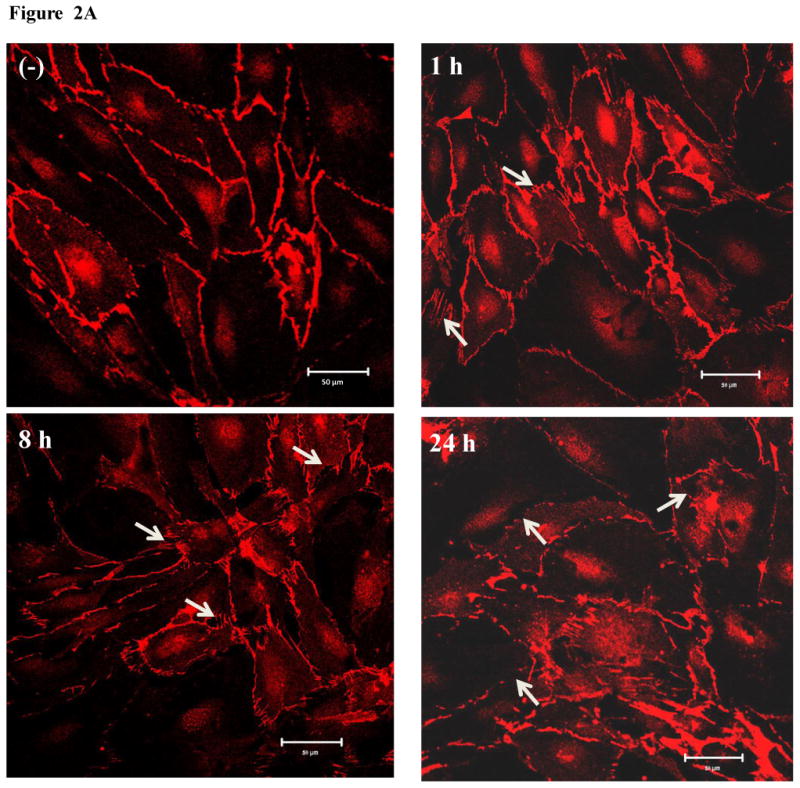
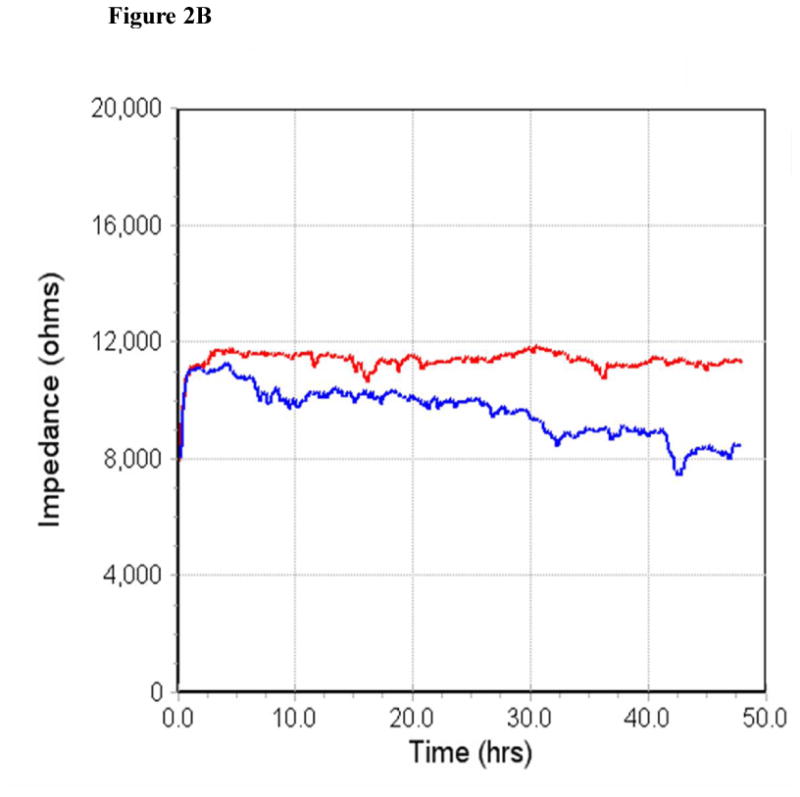
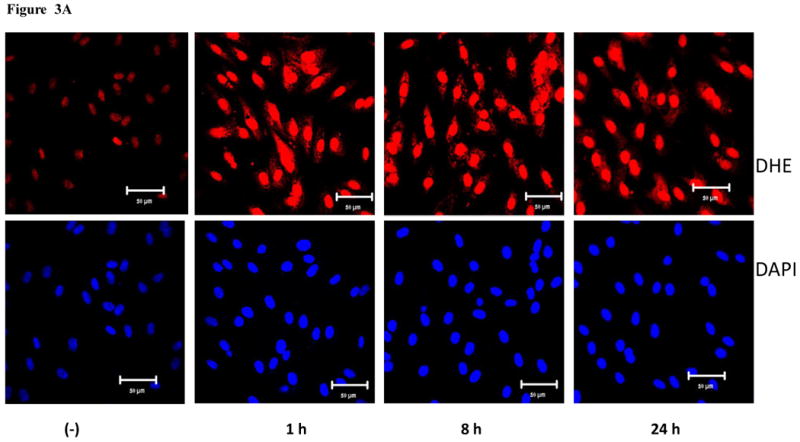
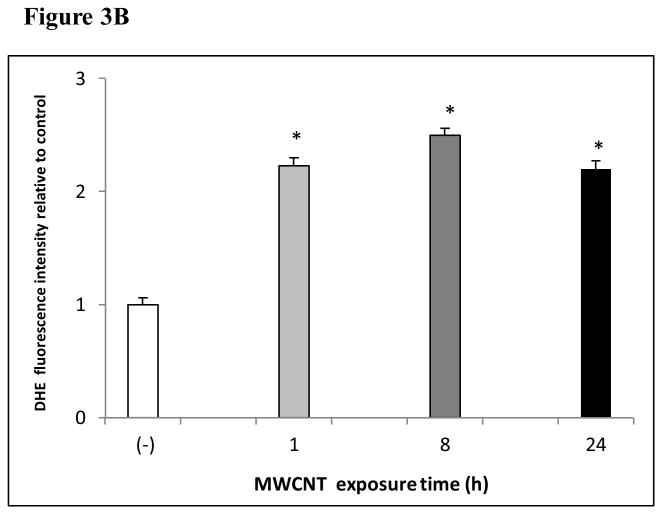
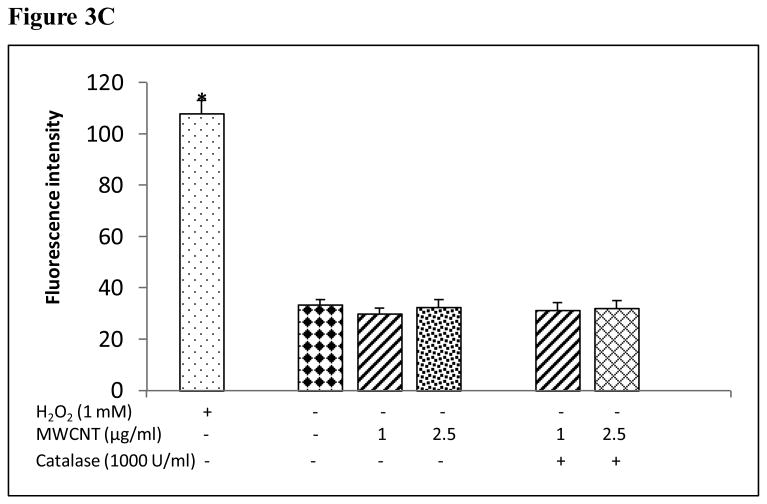
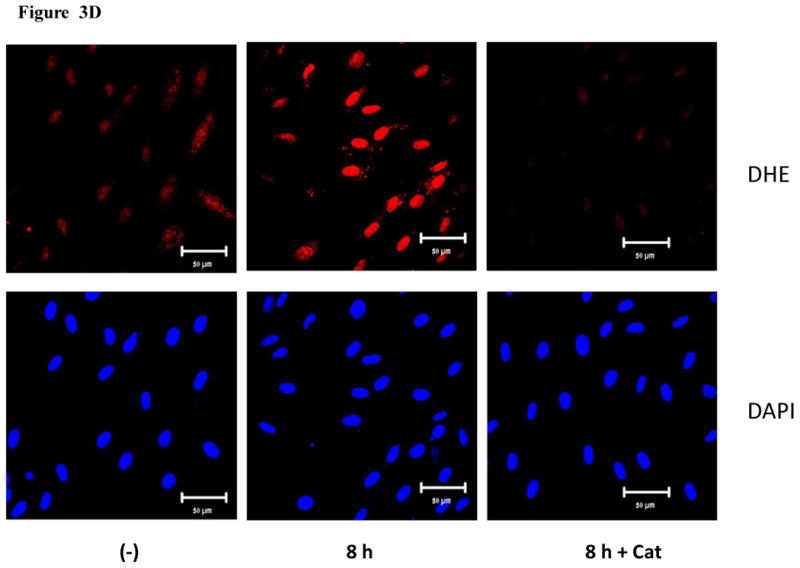
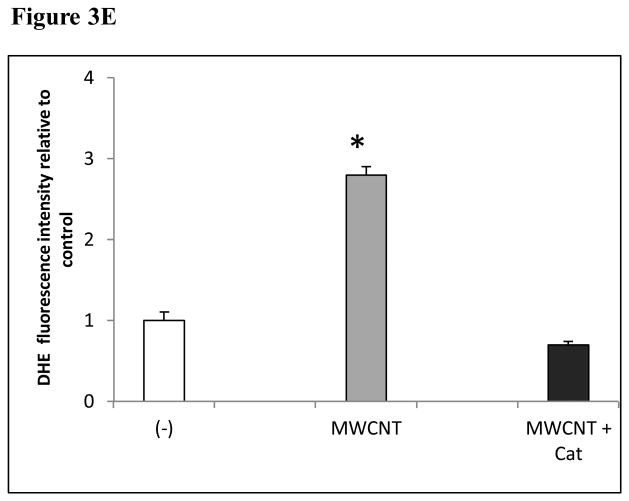
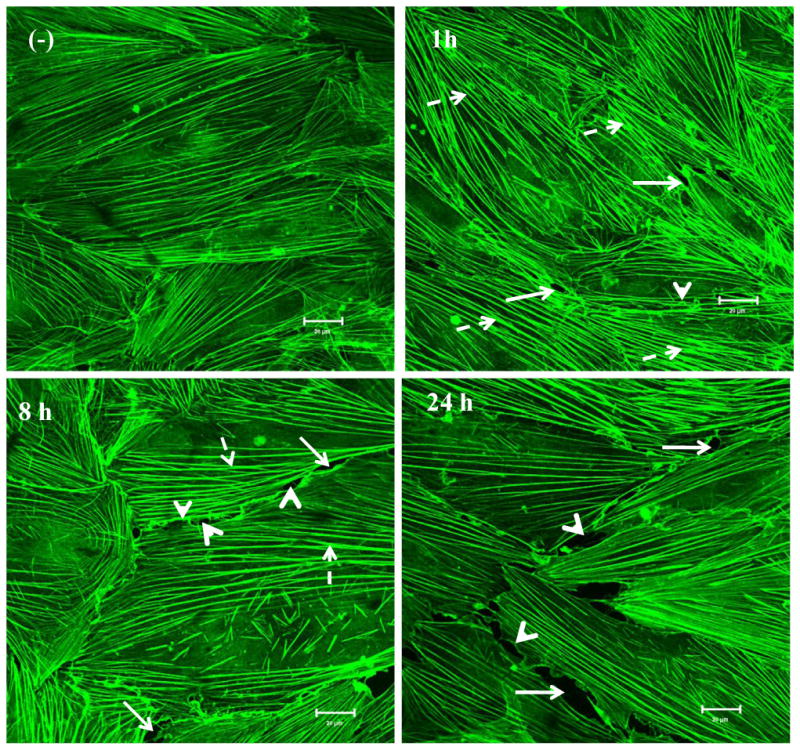
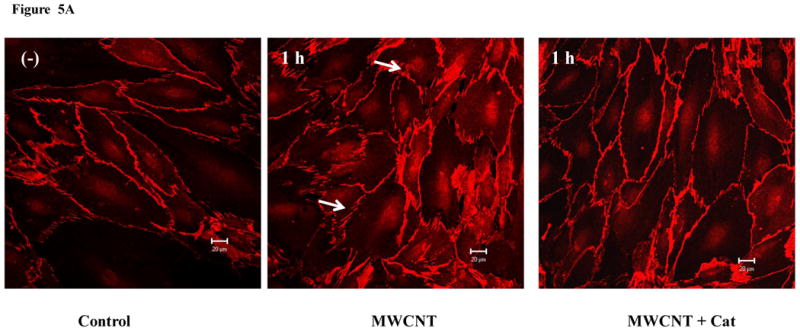
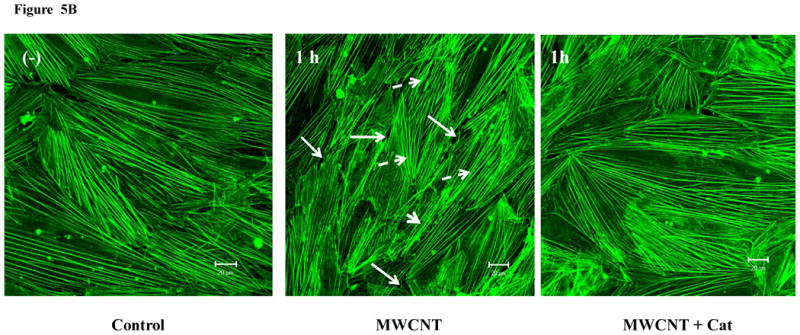
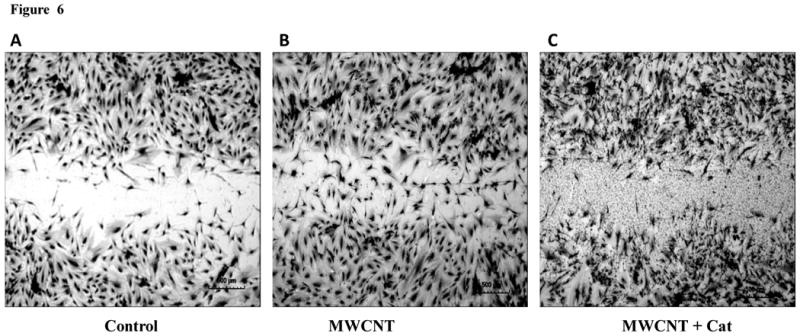
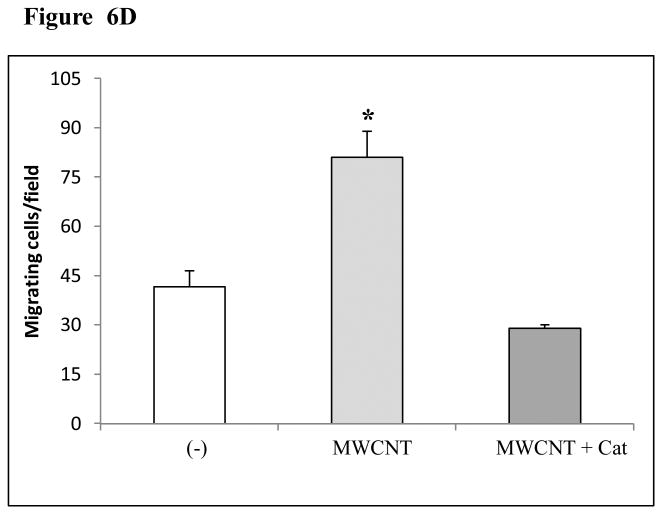
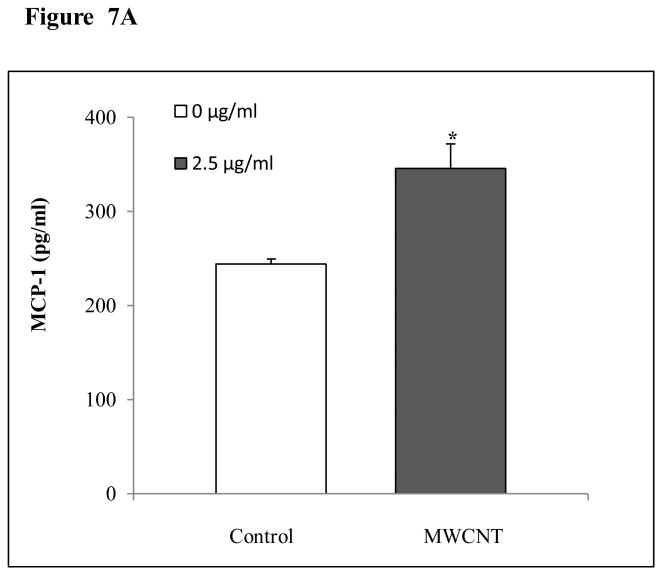
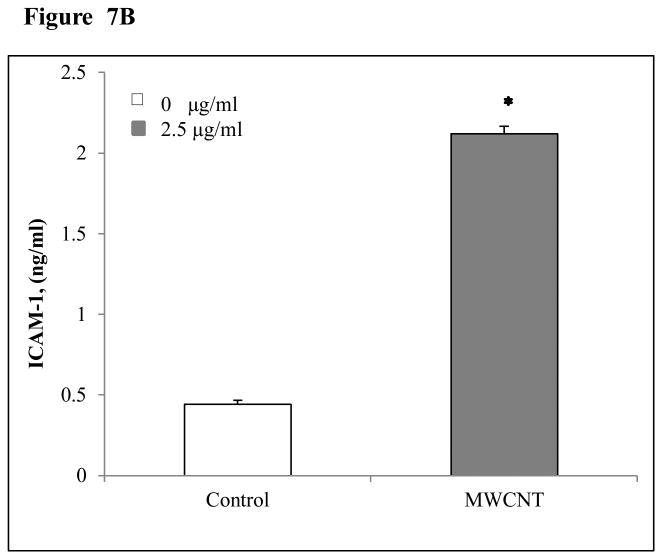
Multiwalled carbon nanotubes (MWCNT) have elicited great interest in biomedical applications due to their extraordinary physical, chemical, and optical properties. Intravenous administration of MWCNT-based medical imaging agents and drugs in animal models was utilized. However, the potential harmful health effects of MWCNT administration in humans have not yet been elucidated. Furthermore, to date, there are no apparent reports regarding the precise mechanisms of translocation of MWCNT into target tissues and organs from blood circulation. This study demonstrates that exposure to MWCNT leads to an increase in cell permeability in human microvascular endothelial cells (HMVEC). The results obtained from this study also showed that the MWCNT-induced rise in endothelial permeability is mediated by reactive oxygen species (ROS) production and actin filament remodeling. In addition, it was found that MWCNT promoted cell migration in HMVEC. Mechanistically, MWCNT exposure elevated the levels of monocyte chemoattractant protein-1 (MCP-1) and intercellular adhesion molecule 1 (ICAM-1) in HMVEC. Taken together, these results provide new insights into the bioreactivity of MWCNT, which may have implications in the biomedical application of MWCNT in vascular targeting, imaging, and drug delivery. The results generated from this study also elucidate the potential adverse effects of MWCNT exposure on humans at the cellular level.


Figures

Figure 1
Figure 1
Uptake of MWCNT by HMVEC. TEM micrographs of HMVEC exposed to MWCNT (2.5 μg/ml) for different periods of time ranging from 30 min to 24 hr. A) Control, B) 30 min, C) 1 hr, D) 4 hr, E) 8 hr, F) 24 hr. Arrows indicate MWCNT containing cytoplasmic vacuoles.
Figure 2
Figure 2
MWCNT increase endothelial cell permeability. A) HMVEC were grown to confluent monolayers on cover slips, serum-starved, and treated with 2.5 μg/ml MWCNT for different periods of time as indicated. After treatment, cells were fixed, permeabilized, and stained with VE-cadherin antibody. A Zeiss confocal microscope was applied to take the images. Arrows indicate gaps in the HMVEC monolayer. Representative micrographs from three independent experiments are shown. (-) unexposed control cells. B) HMVEC were grown to a confluent monolayer on gold microelectrodes, serum-starved, and treated with 2.5 μg/ml MWCNT. TER was measured for 50 hr. Scale bar = 20 μm. Red line represents unexposed control cells and blue line represents MWCNT-exposed cells. Shown here is a representative graph from three independent experiments.
Figure 2
Figure 2
MWCNT increase endothelial cell permeability. A) HMVEC were grown to confluent monolayers on cover slips, serum-starved, and treated with 2.5 μg/ml MWCNT for different periods of time as indicated. After treatment, cells were fixed, permeabilized, and stained with VE-cadherin antibody. A Zeiss confocal microscope was applied to take the images. Arrows indicate gaps in the HMVEC monolayer. Representative micrographs from three independent experiments are shown. (-) unexposed control cells. B) HMVEC were grown to a confluent monolayer on gold microelectrodes, serum-starved, and treated with 2.5 μg/ml MWCNT. TER was measured for 50 hr. Scale bar = 20 μm. Red line represents unexposed control cells and blue line represents MWCNT-exposed cells. Shown here is a representative graph from three independent experiments.
Figure 3
Figure 3
MWCNT induce the production of ROS. A) HMVEC were grown on cover slips, serum-starved, and treated with MWCNT (2.5 μg/ml) for different periods of time as indicated. The production of ROS was determined by pre-treating the cells with DHE as described in Materials and Methods. DAP1 was used to stain cell nuclei. Shown here are representative micrographs from three independent experiments. Scale bar = 50 μm. B) Time-course of ROS production. DHE fluorescence intensity of MWCNT-treated samples relative to non-treated control samples was determined as described in Materials and Methods. Data (mean ± SEM) are representatives of three independent experiments. *, t-test, p ≤ 0.05 versus control, n = 3. C) MWCNT do not induce ROS production in a cell-free system. DHE (5 μM) was mixed with H2O2, MWCNT, or catalase as indicated, followed by measurement of the fluorescence intensity of oxidized DHE using a cytoflour series 4000 fluorescence plate reader. Data represent means ± SEM of three experiments. *, significant at p ≤ 0.05, t-test. D) HMVEC were grown on cover slips, serum-starved, and treated with 2.5 μg/ml MWCNT with or without catalase pretreatment (1000 U/ml) for 8 hr. The production of ROS was determined according to the methods described in Materials and Methods. DAP1 was used to stain cell nuclei. E) Catalase pretreatment (1000 U/ml for 8 hr) inhibits MWCNT (2.5 μg/ml)-induced ROS production in HMVEC. DHE fluorescence intensity was determined as described in Materials and Methods. Data (mean ± SEM) are representatives of three independent experiments. *, t-test, p ≤ 0.05 versus non-treated control, n = 3. DHE = dihyroethidium, DAPI = 4′,6-diamidino-2-phenylindole.
Figure 3
Figure 3
MWCNT induce the production of ROS. A) HMVEC were grown on cover slips, serum-starved, and treated with MWCNT (2.5 μg/ml) for different periods of time as indicated. The production of ROS was determined by pre-treating the cells with DHE as described in Materials and Methods. DAP1 was used to stain cell nuclei. Shown here are representative micrographs from three independent experiments. Scale bar = 50 μm. B) Time-course of ROS production. DHE fluorescence intensity of MWCNT-treated samples relative to non-treated control samples was determined as described in Materials and Methods. Data (mean ± SEM) are representatives of three independent experiments. *, t-test, p ≤ 0.05 versus control, n = 3. C) MWCNT do not induce ROS production in a cell-free system. DHE (5 μM) was mixed with H2O2, MWCNT, or catalase as indicated, followed by measurement of the fluorescence intensity of oxidized DHE using a cytoflour series 4000 fluorescence plate reader. Data represent means ± SEM of three experiments. *, significant at p ≤ 0.05, t-test. D) HMVEC were grown on cover slips, serum-starved, and treated with 2.5 μg/ml MWCNT with or without catalase pretreatment (1000 U/ml) for 8 hr. The production of ROS was determined according to the methods described in Materials and Methods. DAP1 was used to stain cell nuclei. E) Catalase pretreatment (1000 U/ml for 8 hr) inhibits MWCNT (2.5 μg/ml)-induced ROS production in HMVEC. DHE fluorescence intensity was determined as described in Materials and Methods. Data (mean ± SEM) are representatives of three independent experiments. *, t-test, p ≤ 0.05 versus non-treated control, n = 3. DHE = dihyroethidium, DAPI = 4′,6-diamidino-2-phenylindole.
Figure 4
Figure 4
MWCNT induce actin filament remodeling. HMVEC cells were grown on cover slips, serum-starved, and treated with 2.5 μg/ml MWCNT for different periods of time as indicated. After treatment, the cells were fixed, permeabilized, and stained with Alexa-546 phalloidin for actin filaments, followed by confocal microscopy analysis. Arrows indicate gaps; broken arrows indicate stress fibers (contractile bundles of actin filaments); arrow heads indicate lamellipodia (a meshwork of actin filaments at the cell periphery) and filopodia (actin-rich surface protrusions). Shown here are representative micrographs from three independent experiments. Scale bars = 20 μm.
Figure 5
Figure 5
ROS mediate MWCNT-induced endothelial cell permeability and actin filament remodeling. A) HMVEC were grown to a confluent monolayer on cover slips, serum-starved, and pretreated with catalase (1000 U/ml) for 30 min, followed by exposure to 2.5 μg/ml MWCNT for 1 hr. The change in permeability was determined according to the methods described in Figure 2. Arrows indicate gaps in HMVEC monolayer. B) HMVEC cells were grown on cover slips, serum-starved, and pretreated with catalase (1000 U/ml) for 30 min, followed by exposure to 2.5 μg/ml MWCNT for 1 hr. After the treatment, the cells were analyzed according to the methods described in Figure 4. Arrows indicate gaps; broken arrows indicate stress fibers; arrow heads indicate lamellipodia and filopodia. Shown here are representative micrographs from three independent experiments. Scale bars = 20 μm.
Figure 5
Figure 5
ROS mediate MWCNT-induced endothelial cell permeability and actin filament remodeling. A) HMVEC were grown to a confluent monolayer on cover slips, serum-starved, and pretreated with catalase (1000 U/ml) for 30 min, followed by exposure to 2.5 μg/ml MWCNT for 1 hr. The change in permeability was determined according to the methods described in Figure 2. Arrows indicate gaps in HMVEC monolayer. B) HMVEC cells were grown on cover slips, serum-starved, and pretreated with catalase (1000 U/ml) for 30 min, followed by exposure to 2.5 μg/ml MWCNT for 1 hr. After the treatment, the cells were analyzed according to the methods described in Figure 4. Arrows indicate gaps; broken arrows indicate stress fibers; arrow heads indicate lamellipodia and filopodia. Shown here are representative micrographs from three independent experiments. Scale bars = 20 μm.
Figure 6
Figure 6
MWCNT induce cell migration in HMVEC. A-C) HMVEC were grown to confluence, wounded, and exposed to: vehicle (A), 2.5 ug/ml MWCNT (B) or 2.5μg/ml MWCNT + 1000 U/ml catalase (C) for 24 hr. After these treatments, the cells were fixed, permeabilized, stained, and photomicrographed. Shown are representative micrographs from three independent experiments. Scale bar = 500 μm. D) The number of migrating endothelial cells was determined as described in Materials and Methods. Data (mean ± SEM) are representatives of three independent experiments. *, t-test, p ≤ 0.05 versus non-treated control, n = 3.
Figure 6
Figure 6
MWCNT induce cell migration in HMVEC. A-C) HMVEC were grown to confluence, wounded, and exposed to: vehicle (A), 2.5 ug/ml MWCNT (B) or 2.5μg/ml MWCNT + 1000 U/ml catalase (C) for 24 hr. After these treatments, the cells were fixed, permeabilized, stained, and photomicrographed. Shown are representative micrographs from three independent experiments. Scale bar = 500 μm. D) The number of migrating endothelial cells was determined as described in Materials and Methods. Data (mean ± SEM) are representatives of three independent experiments. *, t-test, p ≤ 0.05 versus non-treated control, n = 3.
Figure 7
Figure 7
MWCNT stimulate MCP-1 and ICAM-1 production in HMVEC. A) HMVEC were grown to a confluent monolayer and treated with vehicle or 2.5 μg/ml MWCNT for 24 hr. MCP-1 level was determined as described in Materials and Methods. Data (mean ± SEM) are representatives of three independent experiments. *, t-test, p ≤ 0.05 versus non-treated control, n = 3. B) HMVEC were grown to a confluent monolayer and treated with vehicle or 2.5 μg/ml MWCNT for 8 hr. ICAM-1 level was determined as described in Materials and Methods. Data (mean ± SEM) are representatives of three independent experiments. *, t-test, p ≤ 0.05 versus non-treated control, n = 3.
Figure 7
Figure 7
MWCNT stimulate MCP-1 and ICAM-1 production in HMVEC. A) HMVEC were grown to a confluent monolayer and treated with vehicle or 2.5 μg/ml MWCNT for 24 hr. MCP-1 level was determined as described in Materials and Methods. Data (mean ± SEM) are representatives of three independent experiments. *, t-test, p ≤ 0.05 versus non-treated control, n = 3. B) HMVEC were grown to a confluent monolayer and treated with vehicle or 2.5 μg/ml MWCNT for 8 hr. ICAM-1 level was determined as described in Materials and Methods. Data (mean ± SEM) are representatives of three independent experiments. *, t-test, p ≤ 0.05 versus non-treated control, n = 3.

Similar articles

Cited by

References

    1. Aghajanian A, Wittchen ES, Allingham MJ, Garrett TA, Burridge K. Endothelial cell junctions and the regulation of vascular permeability and leukocyte transmigration. J Thromb Haemost. 2008;6:1453–1460. - PMC - PubMed
    1. Aiso S, Kubota H, Umeda Y, Kasai T, Takaya M, Yamazaki K, Nagano K, Sakai T, Koda S, Fukushima S. Translocation of intratracheally instilled multiwall carbon nanotubes to lung-associated lymph nodes in rats. Ind Health. 2011;49(2):215–20. - PubMed
    1. Aiso S, Yamazaki K, Umeda Y, Asakura M, Kasai T, Takaya M, Toya T, Koda S, Nagano K, Arito H, Fukushima S. Pulmonary toxicity of intratracheally instilled multiwall carbon nanotubes in male Fischer 344 rats. Ind Health. 2010;48(6):783–95. - PubMed
    1. Apopa PL, Qian Y, Shao R, Guo NL, Schwegler-Berry D, Pacurari M, Porter D, Shi X, Vallyathan V, Castranova V, Flynn DC. Iron oxide nanoparticles induce human microvascular endothelial cell permeability through reactive oxygen species production and microtubule remodeling. Part Fibre Toxicol. 2009;6:1. - PMC - PubMed
    1. Asakura M, Sasaki T, Sugiyama T, Takaya M, Koda S, Nagano K, Arito H, Fukushima S. Genotoxicity and cytotoxicity of multi-wall carbon nanotubes in cultured Chinese hamster lung cells in comparison with chrysotile A fibers. J Occup Health. 2010;52:155–166. - PubMed

Publication types

MeSH terms