. 2011 Nov 30:11:347.
doi: 10.1186/1471-2148-11-347.

Integrative analyses of speciation and divergence in Psammodromus hispanicus (Squamata: Lacertidae)

Affiliations

Integrative analyses of speciation and divergence in Psammodromus hispanicus (Squamata: Lacertidae)

Patrick S Fitze et al. BMC Evol Biol. .

Abstract

Background: Genetic, phenotypic and ecological divergence within a lineage is the result of past and ongoing evolutionary processes, which lead ultimately to diversification and speciation. Integrative analyses allow linking diversification to geological, climatic, and ecological events, and thus disentangling the relative importance of different evolutionary drivers in generating and maintaining current species richness.

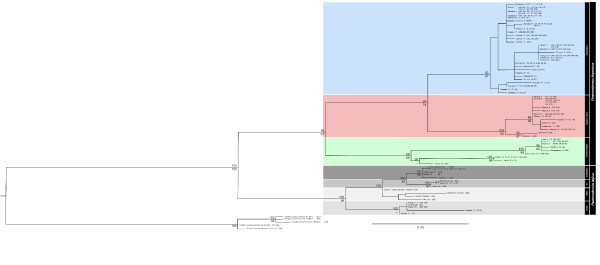
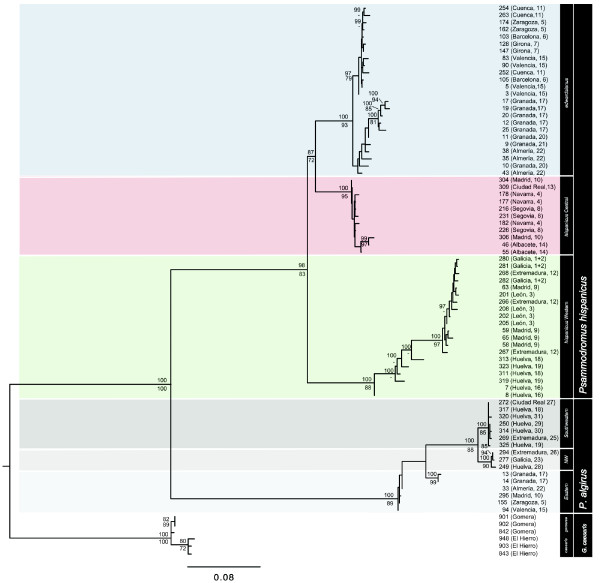
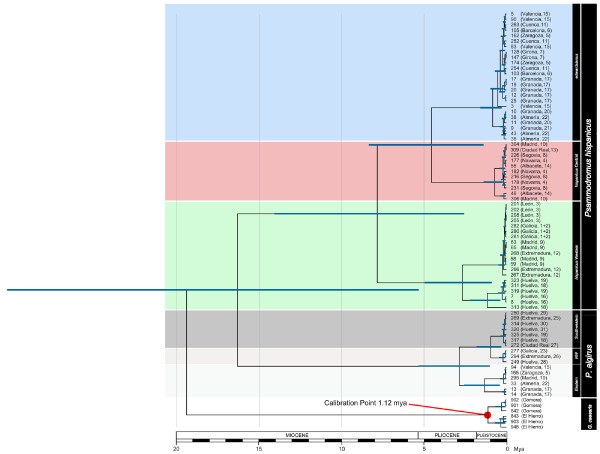
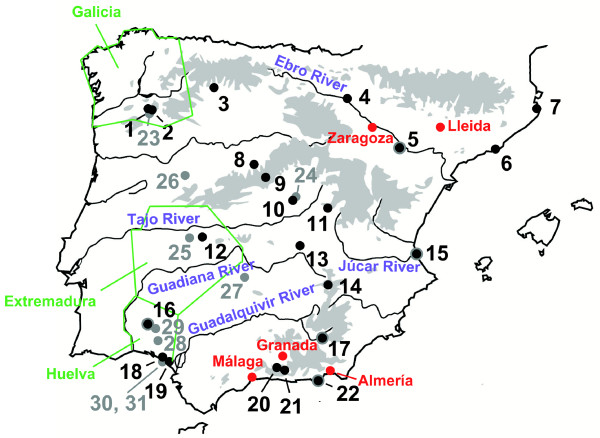
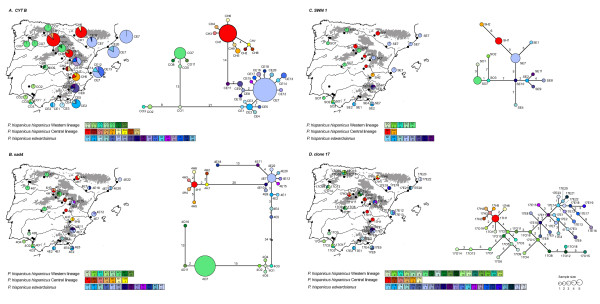
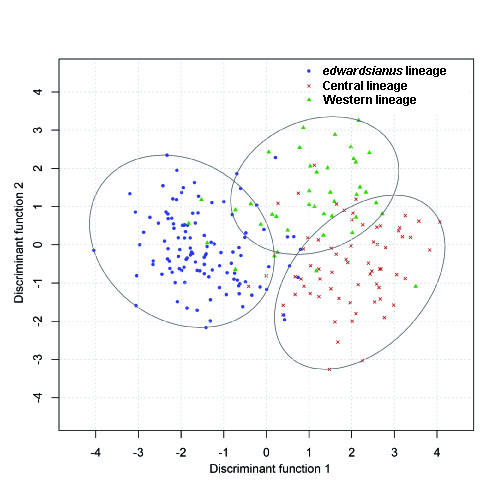
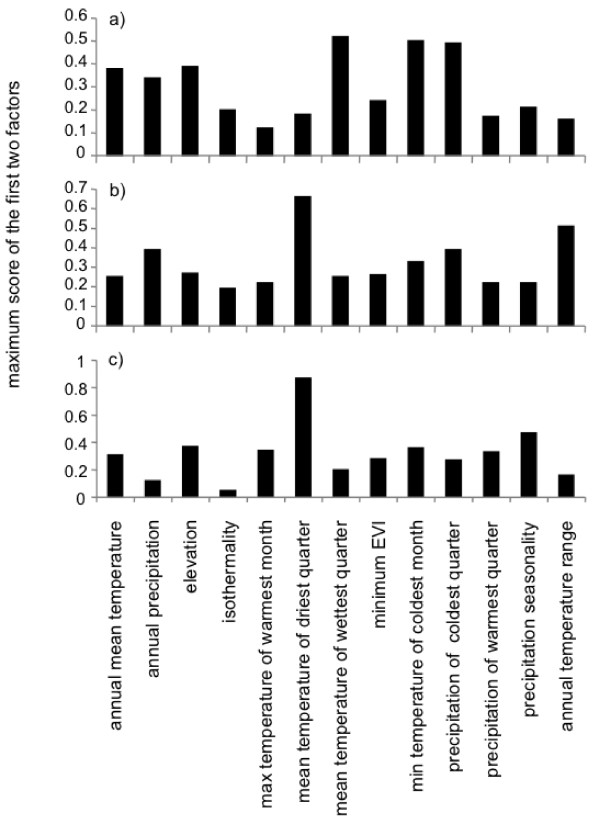
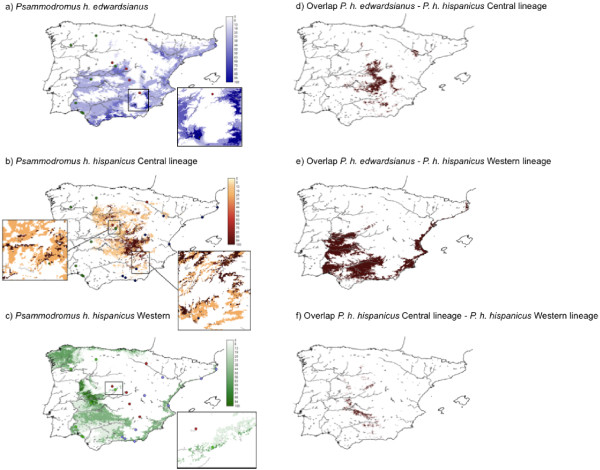
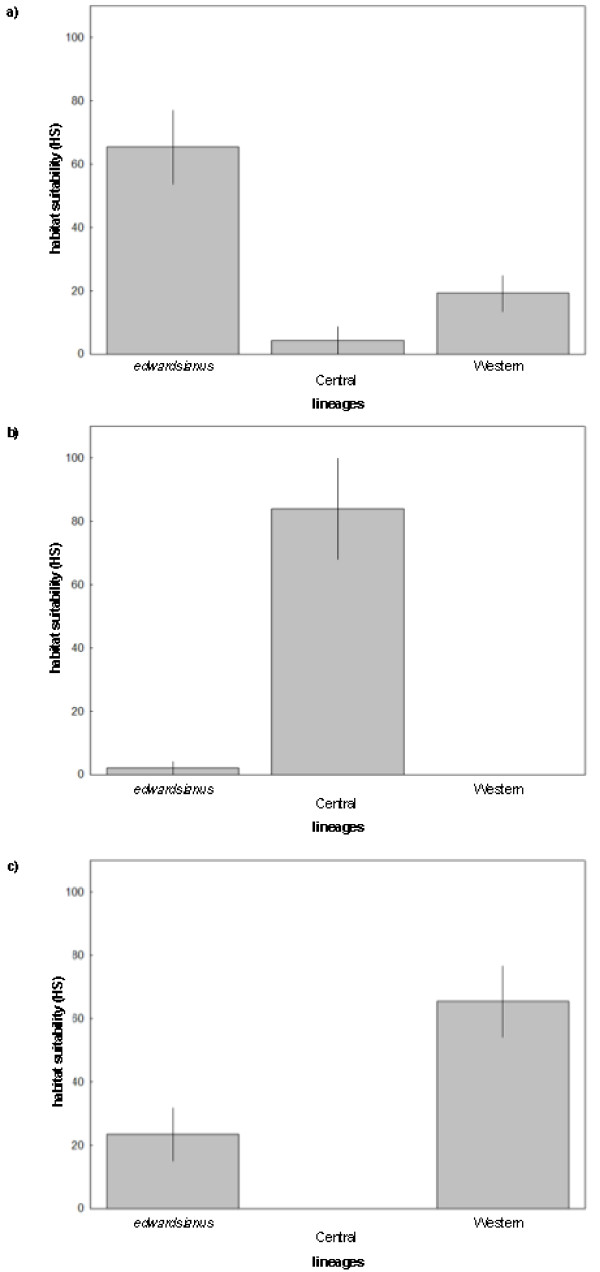
Results: Here, we use phylogenetic, phenotypic, geographic, and environmental data to investigate diversification in the Spanish sand racer (Psammodromus hispanicus). Phylogenetic, molecular clock dating, and phenotypic analyses show that P. hispanicus consists of three lineages. One lineage from Western Spain diverged 8.3 (2.9-14.7) Mya from the ancestor of Psammodromus hispanicus edwardsianus and P. hispanicus hispanicus Central lineage. The latter diverged 4.8 (1.5-8.7) Mya. Molecular clock dating, together with population genetic analyses, indicate that the three lineages experienced northward range expansions from southern Iberian refugia during Pleistocene glacial periods. Ecological niche modelling shows that suitable habitat of the Western lineage and P. h. edwardsianus overlap over vast areas, but that a barrier may hinder dispersal and genetic mixing of populations of both lineages. P. h. hispanicus Central lineage inhabits an ecological niche that overlaps marginally with the other two lineages.

Conclusions: Our results provide evidence for divergence in allopatry and niche conservatism between the Western lineage and the ancestor of P. h. edwardsianus and P. h. hispanicus Central lineage, whereas they suggest that niche divergence is involved in the origin of the latter two lineages. Both processes were temporally separated and may be responsible for the here documented genetic and phenotypic diversity of P. hispanicus. The temporal pattern is in line with those proposed for other animal lineages. It suggests that geographic isolation and vicariance played an important role in the early diversification of the group, and that lineage diversification was further amplified through ecological divergence.


Figures

Figure 1
Figure 1
Maximum likelihood phylogeny based of the mt data set including all 285 Psammodromus specimens. The number above each branch refers to the Bayesian posterior probability (shown as percentage) of the node. Bootstrap values for ML are shown below branches. The sister group to Psammodromus (Gallotia) was used as an outgroup. The sample location and the population number are given. The specimen reference numbers are provided in brackets. For P. algirus, lineage names are given.
Figure 2
Figure 2
Maximum likelihood phylogeny of the genus Psammodromus based on the combined data set. The number above each branch refers to the Bayesian posterior probability (shown as percentage) of the node. Bootstrap values for ML are shown below branches. The sister group to Psammodromus (Gallotia) was used as an outgroup. The species, subspecies, and lineage name, and the specimen's reference number are given. The sample location and the population number are indicated in brackets.
Figure 3
Figure 3
Bayesian relaxed-clock timetree of the genus Psammodromus based on the combined data set. The sister group to Psammodromus (Gallotia) was used as an outgroup and as calibration point for the molecular clock. The species, subspecies, and lineage name and the specimen's reference number are given. The sample location and the population number are indicated in brackets. Estimated ages and 95% confidence intervals are indicated.
Figure 4
Figure 4
Sampling locations and geographic localities mentioned in the article. Numbers correspond to the population numbers indicated in Additional File 1 - Table S1. Black dots indicate populations where individuals of P. hispanicus were sampled and grey dots where individuals of P. algirus were sampled (black and grey dots: populations where individuals of both groups were sampled). Geographic localities mentioned in the article are indicated. Districts are delimited in green, rivers in blue, mountain systems in grey, and cities in red.
Figure 5
Figure 5
Spatial distribution and diversity of mtDNA of P. hispanicus. Spatial distribution and diversity and Minimum-spanning networks of mt cytb (A), mt nad4 (B), nuclear suppressor of SWI4 1 (C) and nuclear clone 17 (D) sequence variation. Pie diagrams represent the haplotypes found at each sampling locality (black dots) and their relative abundance. The size of the pie is proportional to the sample size and the scale is identical for figure 5B, 5C and 5D, and differs for 5A. For minimum- spanning networks, each circle represents a haplotype and its size is proportional to its frequency in the population. Branches represent a single nucleotide change and numbers next to the branches correspond to the number of additional changes. Branch length is proportional to the number of changes.
Figure 6
Figure 6
Differences in phenotype among the three major lineages of P. hispanicus. The discriminant function scores derived from linear combinations of the phenotypic variables [88,89] are shown. Ellipses correspond to the clusters of the three lineages using the 'k-means' clustering method [102]. Each cluster encloses the observations closest to lineage centroid. The three lineages are plotted using different colours: P. hispanicus edwardsianus blue, P. hispanicus hispanicus Central lineage red, P. hispanicus hispanicus Western lineage green.
Figure 7
Figure 7
Relative importance of thirteen ecogeographical variables for predicting lineage distribution using ENFA. The absolute maximum coefficient value of the two most important ENFA factors is given for each predictor and each lineage model: a) P. hispanicus edwardsianus, b) P. hispanicus hispanicus Central lineage, c) P. hispanicus hispanicus Western lineage.
Figure 8
Figure 8
Habitat suitability maps of P. hispanicus lineages. Habitat suitability maps derived from ecological niche models for P. hispanicus edwardsianus (a), P. hispanicus hispanicus Central lineage (b) and P. hispanicus hispanicus Western lineage (c) using seven temperature, four precipitation, one vegetation and one topographic predictor. Sampled populations are indicated by circles (P. hispanicus edwardsianus populations in blue, P. hispanicus hispanicus Central lineage populations in red, Western lineage populations in green), and habitat suitability scores are listed in a graded colour series on the left border of the map. Potential contact zones (see Additional File 3 - Figure S3) are enlarged in separate panels. Overlapping habitat suitability predictions for P. hispanicus edwardsianus and P. hispanicus hispanicus Central lineage (d), P. hispanicus hispanicus Western lineage and P. hispanicus edwardsianus (e), and P. hispanicus hispanicus Central lineage and P. hispanicus hispanicus Western lineage (f) are given in separate panels. In these maps areas are coloured in brown if the habitat suitability scores of a lineage pair were larger than zero for both lineages.
Figure 9
Figure 9
Habitat suitability scores of the P. hispanicus lineages. Differences in habitat suitability scores (HS) between P. hispanicus lineages, predicted by ENFA. Average (± SE) HS scores derived from models for the a) edwardsianus lineage, b) Central lineage, and c) Western lineage for the sampled populations are shown.

Similar articles

Cited by

References

    1. Losos JB. Integrative approaches to evolutionary ecology - Anolis lizards as model systems. Annu Rev Ecol Syst. 1994;25:467–493. doi: 10.1146/annurev.es.25.110194.002343. - DOI
    1. Wiens JJ, Graham CH. Niche conservatism: Integrating evolution, ecology, and conservation biology. Annu Rev Ecol Evol Syst. 2005;36:519–539. doi: 10.1146/annurev.ecolsys.36.102803.095431. - DOI
    1. McCormack JE, Zellmer AJ, Knowles LL. Does niche divergence accompany allopatric divergence in Aphelocoma jays as predicted under ecological speciation?: Insights from tests with niche models. Evolution. 2010;64:1231–1244. - PubMed
    1. Pease KM, Freedman AH, Pollinger JP, McCormack JE, Buermann W, Rodzen J, Banks J, Meredith E, Bleich VC, Schaefer RJ. et al.Landscape genetics of California mule deer (Odocoileus hemionus): the roles of ecological and historical factors in generating differentiation. Mol Ecol. 2009;18(9):1848–1862. doi: 10.1111/j.1365-294X.2009.04112.x. - DOI - PubMed
    1. Mayr E. Systematics and the Origin of Species from the Viewpoint of a Zoologist. New York: Columbia University Press; 1942.

Publication types

Substances