. 2012 Apr;29(4):1141-53.
doi: 10.1093/molbev/msr293. Epub 2011 Nov 29.

Evolution of functionally diverse alleles associated with PTC bitter taste sensitivity in Africa

Affiliations

Evolution of functionally diverse alleles associated with PTC bitter taste sensitivity in Africa

Michael C Campbell et al. Mol Biol Evol. 2012 Apr.

Abstract

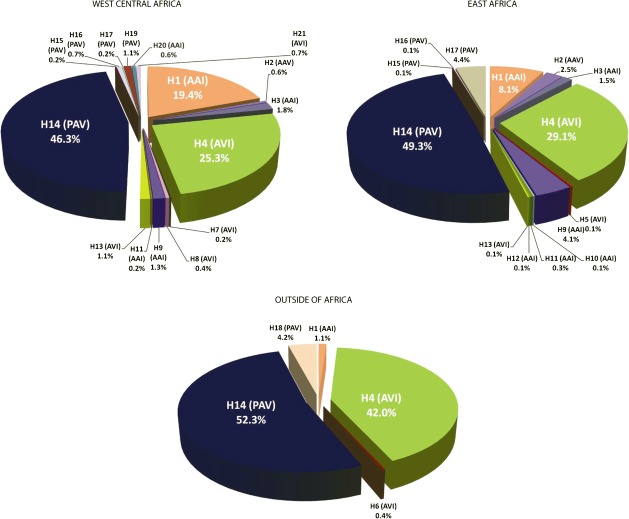
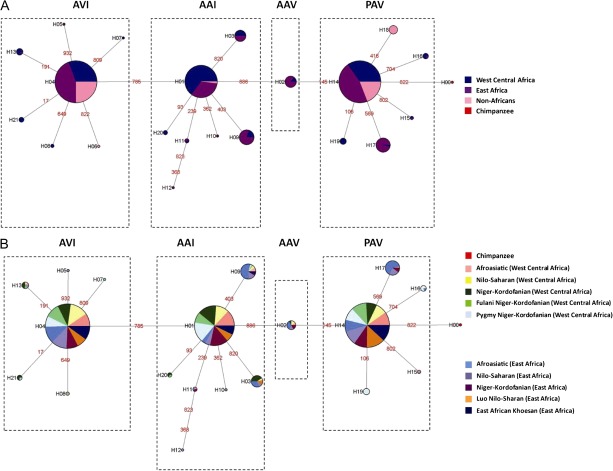
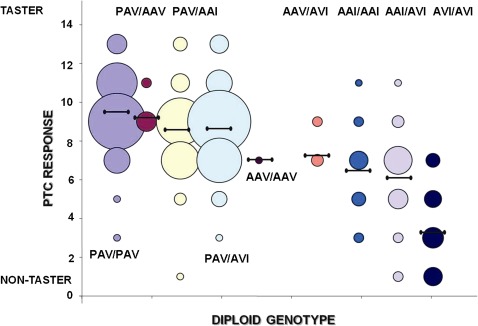
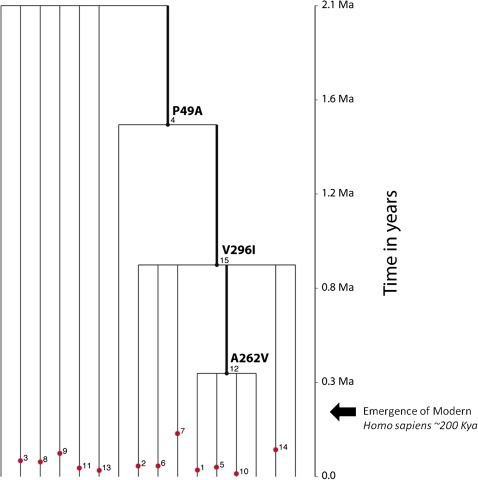
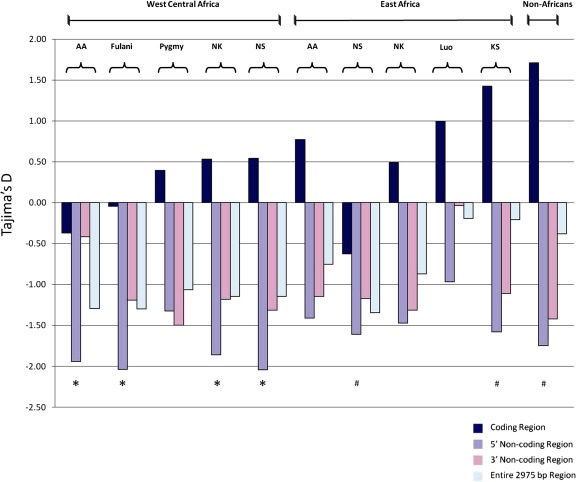
Although human bitter taste perception is hypothesized to be a dietary adaptation, little is known about genetic signatures of selection and patterns of bitter taste perception variability in ethnically diverse populations with different diets, particularly from Africa. To better understand the genetic basis and evolutionary history of bitter taste sensitivity, we sequenced a 2,975 bp region encompassing TAS2R38, a bitter taste receptor gene, in 611 Africans from 57 populations in West Central and East Africa with diverse subsistence patterns, as well as in a comparative sample of 132 non-Africans. We also examined the association between genetic variability at this locus and threshold levels of phenylthiocarbamide (PTC) bitterness in 463 Africans from the above populations to determine how variation influences bitter taste perception. Here, we report striking patterns of variation at TAS2R38, including a significant excess of novel rare nonsynonymous polymorphisms that recently arose only in Africa, high frequencies of haplotypes in Africa associated with intermediate bitter taste sensitivity, a remarkably similar frequency of common haplotypes across genetically and culturally distinct Africans, and an ancient coalescence time of common variation in global populations. Additionally, several of the rare nonsynonymous substitutions significantly modified levels of PTC bitter taste sensitivity in diverse Africans. While ancient balancing selection likely maintained common haplotype variation across global populations, we suggest that recent selection pressures may have also resulted in the unusually high level of rare nonsynonymous variants in Africa, implying a complex model of selection at the TAS2R38 locus in African populations. Furthermore, the distribution of common haplotypes in Africa is not correlated with diet, raising the possibility that common variation may be under selection due to their role in nondietary biological processes. In addition, our data indicate that novel rare mutations contribute to the phenotypic variance of PTC sensitivity, illustrating the influence of rare variation on a common trait, as well as the relatively recent evolution of functionally diverse alleles at this locus.


Figures

F<sc>IG</sc>. 1.
FIG. 1.
Haplotype and subhaplotype frequencies in African and non-African populations. PAV, AVI, AAI, and AAV haplotypes are listed within or in close proximity to each section of the pie charts. The alphanumeric designations outside of parentheses correspond to the list of haplotypes in supplementary table S4 and supplementary table S6 (Supplementary Material online). The common amino acid haplotypes associated with PTC sensitivity are as follows: H14(PAV), H4(AVI), H1(AAI), and H2(AAV). The other haplotypes, referred to as subhaplotypes, are defined by rare variants present on common haplotype backgrounds.
F<sc>IG</sc>. 2.
FIG. 2.
Networks of inferred haplotype relationships based on global and African data. Genealogical relationships of haplotypes were constructed using a maximum parsimony approach for (A) global populations and (B) West Central Africa and East Africa. Circles represent amino acid haplotypes, and the size of the circles is proportional to the number of chromosomes with a given haplotype. Colors within each haplotype represent the proportion of individuals within a population or geographic region with that given haplotype. The lines and numbers are the mutational changes between haplotypes.
F<sc>IG</sc>. 3.
FIG. 3.
A plot of the range of raw phenotype scores (PTC response) for each genotypic class in 463 African individuals. The y axis is PTC response, which is the PTC score of individuals tested in the field. PTC response ranges from 13 to 1, with score 13 representing high PTC sensitivity and score 1 representing low PTC sensitivity. Genotypes are listed in close proximity to each column of bubbles, and the size of bubbles is proportional to the number of individuals with a given PTC score. Horizontal lines indicate the mean PTC score for each genotypic class.
F<sc>IG</sc>. 4.
FIG. 4.
Inferred coalescent gene tree of TAS2R38 nucleotide variation. Common mutations are represented by black dots and rare mutations are indicated by red dots. The ages of polymorphisms are mean estimates of TMRCA with standard deviations listed in supplementary table S11 (Supplementary Material online). Key mutations defining amino acid haplotype clades are numbered. The scale on the right represents time in years (Ma = millions of years ago) and the arrow represents the point at which modern humans evolved (kya = thousands of years ago). Mutation numbers (in small print) assigned by the GENETREE program are given within the tree and correspond to the mutation numbers in supplementary table S11 (Supplementary Material online).
F<sc>IG</sc>. 5.
FIG. 5.
Tajima's D statistic for coding and noncoding regions in Africans and non-Africans. African populations that share genetic and linguistic similarity were grouped together as follows: Niger–Kordofanian speakers (NK), Nilo-Saharan speakers (NS), Afroasiatic speakers (AA), and Khoesan speakers (KS). Some genetically distinct populations within language families were classified as separate groups (e.g., Fulani Niger–Kordofanian speakers, Pygmy Niger–Kordofanian speakers, and Luo Nilo-Saharan speakers) based on a recent genetic study (Tishkoff et al. 2009). Statistically significant (P < 0.05) DT values are denoted by (*) and marginally significant (0.05 < P < 0.1) DT values are denoted by (#).

References

    1. Bandelt HJ, Forster P, Rohl A. Median-joining networks for inferring intraspecific phylogenies. Mol Biol Evol. 1999;16:37–48. - PubMed
    1. Blum MG, Jakobsson M. Deep divergences of human gene trees and models of human origins. Mol Biol Evol. 2011;28:889–898. - PubMed
    1. Bufe B, Breslin PA, Kuhn C, Reed DR, Tharp CD, Slack JP, Kim UK, Drayna D, Meyerhof W. The molecular basis of individual differences in phenylthiocarbamide and propylthiouracil bitterness perception. Curr Biol. 2005;15:322–327. - PMC - PubMed
    1. Bustamante CD, Fledel-Alon A, Williamson S, et al. (14 co-authors). 2005. Natural selection on protein-coding genes in the human genome. Nature. 43:1153–1157. - PubMed
    1. Campbell MC, Tishkoff SA. African genetic diversity: implications for human demographic history, modern human origins, and complex disease mapping. Annu Rev Genomics Hum Genet. 2008;9:403–433. - PMC - PubMed

Publication types

Substances