. 2012 Jan 1;188(1):404-16.
doi: 10.4049/jimmunol.1102124. Epub 2011 Nov 30.

Protection from secondary dengue virus infection in a mouse model reveals the role of serotype cross-reactive B and T cells

Affiliations

Protection from secondary dengue virus infection in a mouse model reveals the role of serotype cross-reactive B and T cells

Simona Zompi et al. J Immunol. .

Abstract

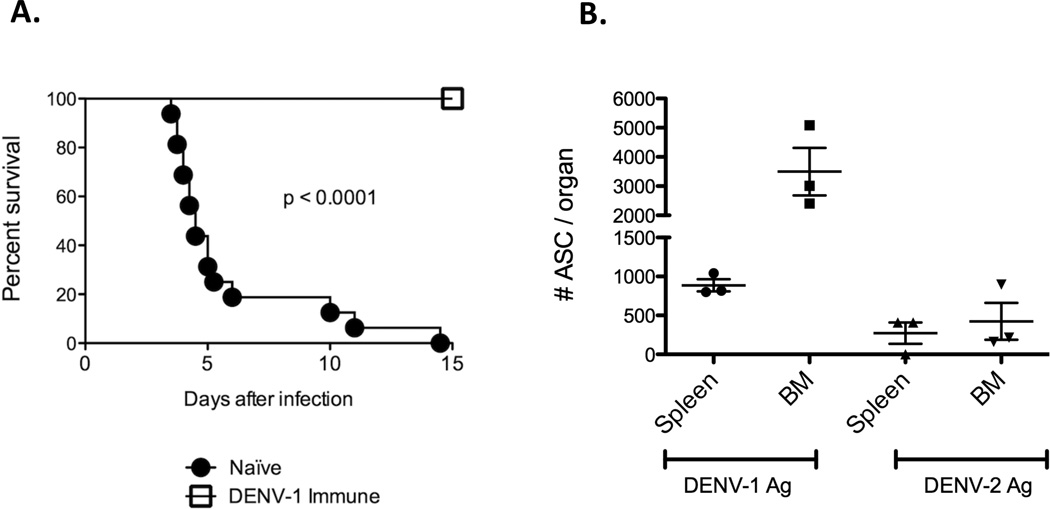
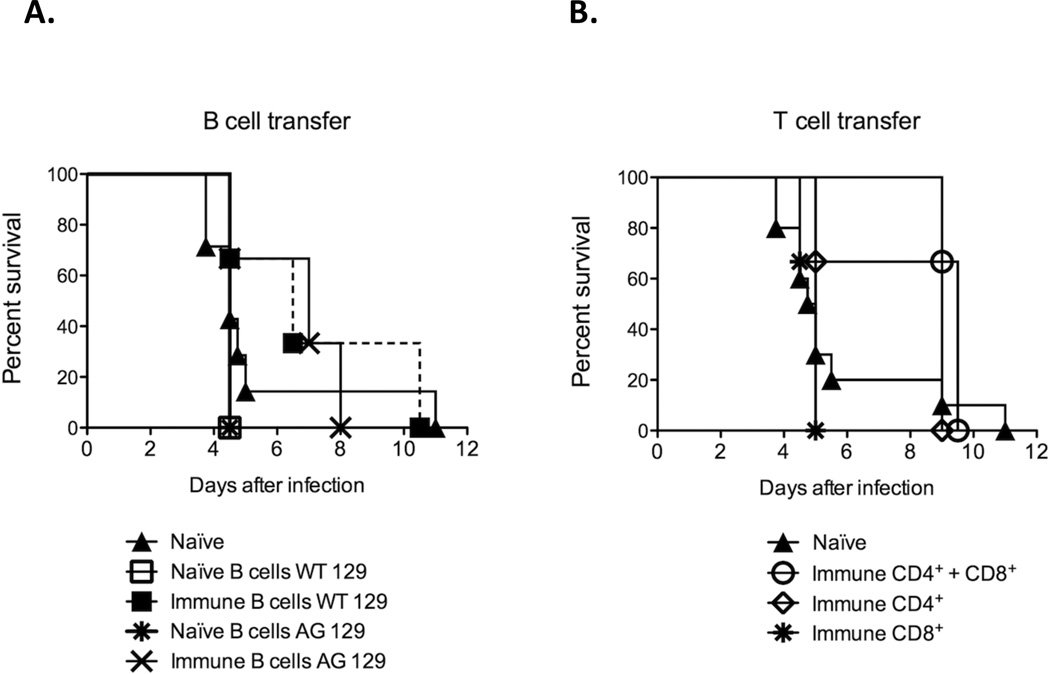
The four dengue virus (DENV) serotypes cause dengue fever and dengue hemorrhagic fever/dengue shock syndrome. Although severe disease has been associated with heterotypic secondary DENV infection, most secondary DENV infections are asymptomatic or result in classic DF. The role of cross-reactive immunity in mediating cross-protection against secondary heterotypic DENV infection is not well understood. DENV infection of IFN-α/β and IFN-γ receptor-deficient (AG129) mice reproduces key features of human disease. We previously demonstrated a role in cross-protection for pre-existing cross-reactive Abs, maintained by long-lived plasma cells. In this study, we use a sequential infection model, infecting AG129 mice with DENV-1, followed by DENV-2 6-8 wk later. We find that increased DENV-specific avidity during acute secondary heterotypic infection is mediated by cross-reactive memory B cells, as evidenced by increased numbers of DENV-1-specific cells by ELISPOT and higher avidity against DENV-1 of supernatants from polyclonally stimulated splenocytes isolated from mice experiencing secondary DENV-2 infection. However, increased DENV-specific avidity is not associated with increased DENV-specific neutralization, which appears to be mediated by naive B cells. Adoptive transfer of DENV-1-immune B and T cells into naive mice prior to secondary DENV-2 infection delayed mortality. Mice depleted of T cells developed signs of disease, but recovered after secondary DENV infection. Overall, we found that protective cross-reactive Abs are secreted by both long-lived plasma cells and memory B cells and that both cross-reactive B cells and T cells provide protection against a secondary heterotypic DENV infection. Understanding the protective immunity that develops naturally against DENV infection may help design future vaccines.


Figures

Figure 1
Figure 1. Protection of DENV-1-immune AG129 mice against a lethal 2° DENV-2 infection
A. Survival of AG129 mice after 1° and 2° DENV infection. AG129 mice were infected s.c. with 105 PFU of DENV-1 98J (DENV-1-immune, n=14) or injected s.c. with C6/36 cell supernatant (Naïve, n=16). Eight weeks post infection (p.i.), the mice were infected i.v. with a lethal dose of DENV-2 D2S10 (107 PFU). Statistical analysis was performed using the Wilcoxon rank-sum test. Survival of DENV-1 immune mice infected with DENV-2 D2S10 was significantly different from Naïve mice infected with DENV-2 D2S10. B. DENV-specific B cell ELISPOT after 1° DENV-1 infection. AG129 mice were infected s.c. with 105 PFU of DENV-1 98J (n=3). Six to eight weeks p.i., spleen and bone marrow were collected and cell suspensions prepared. Cells were tested ex vivo by ELISPOT using DENV-1 and DENV-2 cellular Ag to detect DENV-1 and DENV-2-specific PCs. The number of spots from control wells coated with Mock-Ag was subtracted from the number of spots counted in DENV-coated wells. Statistical analysis was performed using the Mann-Whitney U test. No significant difference in the number of antibody-secreting cells was found between cells tested in the spleen and bone marrow.
Figure 2
Figure 2. Proliferation of memory B cells and PCs after a 2° heterotypic DENV infection
A. Flow cytometry analysis of Ki67+ memory B cells. AG129 mice were infected s.c. with 105 PFU of DENV-1 98J and 6 to 8 weeks p.i. were infected i.v. with 107 PFU of DENV-2 D2S10. A control group was infected with DENV-1 98J and mock-infected with C6/36 cell supernatant (post1°/pre2°). After 3, 6 and 9 days, splenocytes were harvested and stained with anti-B220 PECy7, anti-CD79b FITC, anti-CD138 PerCP Cy5.5, anti-IgD Pacific Blue, and anti-Ki67-PE or isotype control-PE. Cells were gated on B220+, CD79b+, CD138. One representative flow cytometry staining of nine independent experiments is shown. B. Percentage of Ki67+ memory B cells. The percentage of cells that were PE positive using the isotype control Ab were subtracted from the percentage of Ki67-positive cells for each sample to obtain the percentage increase relative to isotype control. Data were pooled from 9 independent repeated experiments with a total of n=19 mice for post1°/pre2°, n=13 mice for day 3, n=15 mice for day 6, and n=6 mice for day 9. Statistical analysis was performed using the Mann-Whitney U test to compare each time-point to the post1°/pre2° samples, and p-value is shown in the graph. No significant difference was found among the groups. C. Absolute number of plasma cells and memory B cells. Splenocytes were treated as in Figure A. Absolute numbers of plasma cells (B220low/−, CD79b+, IgD, CD138+) and memory B cells (B220+, CD79b+, IgD, CD138) in the spleen before and after 2° infection are shown. Data were pooled from 6 independent repeated experiments with a total of n=10 mice for post1°/pre2°, n=11 mice for day 3, n=3 mice for day 6 and n=6 mice for day 9. Statistical analysis was performed using the Mann-Whitney U test to compare each time-point to the post1°/pre2° samples, and p-values are shown below the graph. A statistically significant difference was found in the absolute numbers of PCs at day 6 and in the absolute number of memory B cells at day 9 p.i. when compared to the post1°/pre2° samples. D. Absolute numbers of CD4+ and CD8+ T cells. Splenocytes were treated as in Figure A. Absolute numbers of CD4+ T cells (CD3+, CD4+, CD8) and CD8+ T cells (CD3+, CD4, CD8+) in the spleen before and after 2° infection are shown. Data were pooled from 9 independent repeated experiments with a total of n=16 mice for post1°/pre2°, n=14 mice for day 3, n=10 mice for day 6 and n=5 mice for day 9. Statistical analysis was performed using the Mann-Whitney U test to compare each time-point to the post1°/pre2° samples, and p-values are shown beneath the graph. A statistically significant difference was observed in the absolute numbers of CD8+ T cells at day 9 p.i. when compared to the post1°/pre2° samples.
Figure 3
Figure 3. DENV-specific neutralization capacity of serum after 1° and 2° heterotypic DENV infection
A. Neutralizing antibody titers after 2° DENV infection. AG129 mice were infected s.c. with 105 PFU of DENV-1 98J and 6 to 8 weeks p.i. were infected i.v. with 107 PFU of DENV-2 D2S10. A control group was infected with DENV-1 98J and mock-infected for the second infection (post1°/pre2°). After 3, 6 or 9 days, serum was collected and tested in a U937-DC-SIGN flow cytometry-based neutralization assay against DENV-2 D2S10. The dashed line corresponds to 50% neutralization, and the 50% neutralization titers (NT50) are shown in the legend. For each time-point, the neutralization data are pooled from 4 to 6 mice were pooled from 2 independent repeated experiments. Statistical analysis was performed using the Mann-Whitney U test in order to compare the NT50 of each time-point to the NT50 of the post1°/pre2° serum. A statistically significant difference in NT50 titer was found at day 6 and day 9 post-2° infection when compared to the NT50 of the post1°/pre2° serum; p-values are shown in the symbol figure legend. B. Neutralizing antibody titers after 1° DENV infection. AG129 mice were infected i.v. with 105 PFU of DENV-2 D2S10. A control group of mice was mock-infected with C6/36 cell supernatant (Naïve). After 3 and 6 days, serum was collected from DENV-2 D2S10-infected and naïve mice and tested in a U937-DC-SIGN flow cytometry-based neutralization assay against DENV-2 D2S10. The dashed line corresponds to 50% neutralization, and the 50% neutralization titers (NT50) are shown in the legend. For each time-point, data were pooled from 3 to 6 mice from 2 independent repeated experiments. Statistical analysis was performed using the Mann-Whitney test. Each time-point (day 6, day 9 and day 14) was compared to the day 3 serum. A statistically significant difference in NT50 was found at day 6 post-infection when compared to the NT50 of day 3 serum; p-values are shown in the symbol legend. C. DENV-1-specific neutralization capacity of serum after 2° heterotypic DENV infection. Neutralizing antibody titers after 2° DENV infection are shown. AG129 mice were infected s.c. with 105 PFU of DENV-1 98J and 6 to 8 weeks p.i. were infected i.v. with 107 PFU of DENV-2 D2S10. A control group was infected with DENV-1 98J and mock-infected for the second infection (post1°/pre2°). After 3, 6 or 9 days, serum was collected and tested in a U937-DC-SIGN flow cytometry-based neutralization assay against DENV-1 98J. The dashed line corresponds to 50% neutralization, and the 50% neutralization titers (NT50) are shown in the symbol legend. For each time point, data are pooled from 5 to 6 mice from 2 independent experiments. Statistical analysis was performed using the Mann-Whitney U test to compare the NT50 of each time point to the NT50 of the post1°/pre2° serum. No significant difference was found among the different time-points.
Figure 4
Figure 4. DENV-specific avidity of serum and supernatant of polyclonally-stimulated splenocytes after a 2° heterotypic DENV infection
A. DENV-specific avidity of serum measured by ELISA using different concentrations of urea. AG129 mice were infected s.c. with 105 PFU of DENV-1 98J and 6 to 8 weeks later were mock-infected with C6/36 cell supernatant (post1°/pre2°). Serum was harvested on days 6 and 9 p.i. and tested in a urea-based ELISA assay using 6 to 9M urea and recombinant E protein from DENV-1 or DENV-2 as antigen to measure avidity against DENV-1 and DENV-2, respectively. Data are pooled from 3 to 5 mice from 2 independent experiments. B. DENV-specific avidity of serum measured by ELISA using different concentrations of urea at day 3 p.i.. AG129 mice were infected s.c. with 105 PFU of DENV-1 98J and 6 to 8 weeks later were infected i.v. with 107 PFU of DENV-2 D2S10. Serum was harvested on day 3 p.i. and tested in a urea-based ELISA assay using 6 to 9M urea and recombinant E protein from DENV-1 or DENV-2 as antigen to measure avidity against DENV-1 and DENV-2, respectively. Data are pooled from 6 mice from 2 independent experiments. C. DENV-specific avidity of serum measured by ELISA using different concentrations of urea at day 6 p.i.. Mice were infected as in Figure 4B. Serum was harvested at day 6 p.i. and processed as in Figure 4B. Data are pooled from 12 mice from 4 independent experiments. D. DENV-specific avidity of serum measured by ELISA using different concentrations of urea at day 9 p.i.. Mice were infected as in Figure 4B. Serum was harvested at day 9 p.i. and processed as in Figure 4B. Data are pooled from 12 mice from 4 independent experiments. E. DENV-specific serum avidity measured by ELISA using 7M urea. AG129 mice were infected s.c. with 105 PFU of DENV-1 98J and 6 to 8 weeks p.i. were infected i.v. with 107 PFU of DENV-2 D2S10. A control group was infected with DENV-1 98J and mock-infected with C6/36 cell supernatant (post1°/pre2°). Serum was harvested on days 3, 6 and 9 p.i. and tested in an urea-based ELISA assay using 7M urea and recombinant E protein from DENV-1 or DENV-2 as antigen to measure avidity against DENV-1 and DENV-2, respectively. Data are pooled from 10 to 22 mice for each group from 9 repeated independent experiments. Statistical analysis was performed using the Mann-Whitney U test to compare the % of IgG bound after urea washes at each time-point to the % of IgG bound after urea washes of the post1°/pre2° serum. A statistically significant difference in % of IgG bound in serum was found at day 6 and day 9 post-2° infection when compared to the % of IgG bound in the post1°/pre2° serum for both DENV-1 and DENV-2 Ag; p-values are shown below the graphs. F. DENV-specific avidity in supernatants from polyclonally-stimulated splenocytes measured by ELISA using 7M urea. Mice were infected as in Figure 4E. Spleens were harvested on days 3 and 6 p.i.. Splenocytes were polyclonally stimulated with PWM extract, CpG oligonucleotide, fixed S. aureus Cowan, and LPS, and supernatants were collected 5–6 days post-stimulation. Supernatants were tested in a urea-based ELISA assay using 7M urea and recombinant E protein from DENV-1 or DENV-2 as antigen to measure avidity against DENV-1 and DENV-2, respectively. Data are pooled from 5 to 7 mice for each group from 3 repeated independent experiments. Statistical analysis was performed using the Mann-Whitney U test to compare the % of IgG bound after urea washes at each time-point to the % of IgG bound after urea washes of the post1°/pre2° supernatants. No significant difference was found for either DENV-1 or DENV-2 Ag.
Figure 5
Figure 5. Number of DENV-specific memory B cells and PCs after 1° and 2° heterotypic DENV infection
A. DENV-1-specific memory B cells detected by ELISPOT. AG129 mice were infected either with 105 PFU of DENV-2 D2S10 i.v. (1° infection) or with 105 PFU of DENV-1 98J s.c. (1° infection) then 6 to 8 weeks p.i., infected i.v. with 107 PFU of DENV-2 D2S10 (2° infection). A control group was mock-infected (Naïve or Post1°/Pre2°). After 3, 6, 9 and 14 days, splenocytes were harvested and polyclonally stimulated in vitro for 6 days to obtain ASCs. ASCs against DENV-1 were tested by ELISPOT using cellular Ag to detect DENV-1-specific memory B cells. The number of spots from control wells coated with Mock-Ag was subtracted from the number of spots counted in DENV-coated wells. Statistical analysis was performed using the Mann-Whitney test to compare the number of DENV-1-specific memory B cells at each time-point to the number of DENV-1-specific memory B cells from naïve or post1°/pre2° mock-infected mice. A statistically significant difference was found at day 9 and day 14 post-1° infection; p-values are shown below each graph. B. DENV-2-specific memory B cells detected by ELISPOT. Cells were prepared as in Figure 5A and were tested by ELISPOT using DENV-2 cellular Ag to detect DENV-2-specific memory B cells. Statistical analysis was performed using the Mann-Whitney U test to compare the number of DENV-2-specific memory B cells at each time-point to the number of DENV-2-specific memory B cells from naïve or post1°/pre2° mock-infected mice. A statistically significant difference was found at day 9 and day 14 post-1° infection and at day 6 and day 9 post-2° infection; p-values are shown below each graph. C. DENV-1-specific PCs detected by ELISPOT. Cells were prepared as in Figure 5A and tested ex vivo by ELISPOT using DENV-1 cellular Ag to detect DENV-1-specific PCs. Statistical analysis was performed using the Mann-Whitney U test to compare the number of DENV-1-specific PCs at each time-point to the number of DENV-1-specific PCs from naïve or post1°/pre2° mock-infected mice. A statistically significant difference was found at day 6, day 9 and day 14 post-1° infection and at day 6 and day 9 post-2° infection; p-values are shown below each graph. D. DENV-2-specific PCs detected by ELISPOT. Cells were prepared as in Figure 5A and were tested by ELISPOT ex vivo using DENV-2 cellular Ag to detect DENV-2-specific PCs. Statistical analysis was performed using the Mann-Whitney U test to compare the number of DENV-2-specific PCs at each time-point to the number of DENV-2-specific PCs from naïve or post1°/pre2° mock-infected mice. A statistically significant difference was found at day 6, day 9 and day 14 post-1° infection and at day 9 post-2° infection; p-values are shown below each graph.
Figure 6
Figure 6. Mortality and morbidity after B and T cell depletions during 2° heterotypic DENV infection
A. Survival after B and T cell depletions. AG129 mice were infected s.c. with 105 DENV-1 98J then 6 to 8 weeks p.i. were infected i.v. with 107 PFU of DENV-2 D2S10. T cell-depleted mice (n=7) were treated with anti-CD4 and anti-CD8 mAb as described in Material and Methods. B cell-depleted mice (n=4) were treated with anti-CD20 mAb as described in Material and Methods. Four mice were depleted of both B and T cells. DENV-1-immune control mice were injected with PBS (n=7) or isotype control (n=3). Naïve mice (n=4) were infected i.v. with 107 PFU of DENV-2 D2S10. Data were pooled from 2 independent experiments. Statistical analysis was performed using the Wilcoxon rank sum test to compare the different experimental groups to the naïve group. No significant differences were found. B. Morbidity after B and T cell depletions. The same mice as in Figure 6A were scored for morbidity. An event was counted as soon as the mice were recorded as sick (score = 2) as described in Material and Methods. Statistical analysis was performed using the Wilcoxon rank sum test to compare the different experimental groups to the naïve group. No significant differences were found.
Figure 7
Figure 7. Protection against a lethal DENV-2 infection mediated by B and T cell adoptive transfers
A. Adoptive transfer of B cells. 30×106 B cells from AG129 or WT129 naïve or DENV-1-immune mice were adoptively transferred into naïve AG129 mice (3 mice/group). Control naïve mice (n=7) received PBS with no cells. Twenty-four hours after transfer, mice were infected i.v. with 107 PFU of DENV-2 D2S10. Statistical analysis was performed using the Wilcoxon rank sum test to compare the different experimental groups to the naïve group. No significant differences were found. B. Adoptive transfer of T cells. 2×10⁵ CD4+ T cells, CD8+ T cells, or a mixture of CD4+ and CD8+ T cells isolated from DENV-1-immune A129 mice were adoptively transferred into naïve AG129 mice (3 mice/group). Control naïve mice (n=10) received PBS with no cells. Twenty-four hours after transfer, mice were infected i.v. with 107 PFU of DENV-2 D2S10. Data shown were from one experiment. Statistical analysis was performed using the Wilcoxon rank sum test to compare the different experimental groups to the naïve group. No significant differences were found.

References

    1. Gubler DJ. Epidemic dengue/dengue hemorrhagic fever as a public health, social and economic problem in the 21st century. Trends Microbiol. 2002;10:100–103. - PubMed
    1. Guzman MG, Kouri GP, Bravo J, Soler M, Vazquez S, Morier L. Dengue hemorrhagic fever in Cuba, 1981: a retrospective seroepidemiologic study. Am. J. Trop. Med. Hyg. 1990;42:179–184. - PubMed
    1. Sabin AB. Research on dengue during World War II. Am. J. Trop. Med. Hyg. 1952;1:30–50. - PubMed
    1. Sangkawibha N, Rojanasuphot S, Ahandrik S, Viriyapongse S, Jatanasen S, Salitul V, Phanthumachinda B, Halstead SB. Risk factors in dengue shock syndrome: a prospective epidemiologic study in Rayong, Thailand. I. The 1980 outbreak. Am. J. Epidemiol. 1984;120:653–669. - PubMed
    1. Thein S, Aung MM, Shwe TN, Aye M, Zaw A, Aye K, Aye KM, Aaskov J. Risk factors in dengue shock syndrome. Am. J. Trop. Med. Hyg. 1997;56:566–572. - PubMed

Publication types