. 2011 Nov 30;31(48):17392-405.
doi: 10.1523/JNEUROSCI.3407-11.2011.

A computational model for the influence of corollary discharge and proprioception on the perisaccadic mislocalization of briefly presented stimuli in complete darkness

Affiliations

A computational model for the influence of corollary discharge and proprioception on the perisaccadic mislocalization of briefly presented stimuli in complete darkness

Arnold Ziesche et al. J Neurosci. .

Abstract

Spatial perception, the localization of stimuli in space, can rely on visual reference stimuli or on egocentric factors such as a stimulus position relative to eye gaze. In total darkness, only an egocentric reference frame provides sufficient information. When stimuli are briefly flashed around saccades, the localization error reveals potential mechanisms of updating such reference frames as described in several theories and computational models. Recent novel experimental evidence, however, showed that the maximum amount of mislocalization does not scale linearly with saccade amplitude but rather stays below 13° even for long saccades, which is different from predicted by present models. We propose a new model of perisaccadic mislocalization in complete darkness to account for this observation. According to this model, mislocalization arises not on the motor side by comparing a retinal position signal with an extraretinal eye position related signal but by updating stimulus position in visual areas through a combination of proprioceptive eye position and corollary discharge. Simulations with realistic input signals and temporal dynamics show that both signals together are used for spatial updating and in turn bring about perisaccadic mislocalization.


Figures
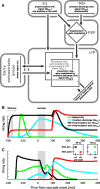
Figure 1.
Figure 1.
A, Our model of perisaccadic shift is composed of two cell types (in LIP), XbPC and XbCD, which receive retinal input from early extrastriate areas as well as eye position information presumably from S1 and FEF. The input layer (Xr) represents stimulus position retinotopically in a single dimension, modeled by Gaussian receptive fields whose width depend linearly on the eccentricity of the stimulus (Hamker et al., 2008). The stimulus signal is gain modulated in XbPC by the PC eye position signal (XePC). Similarly, another set of cells are gain modulated in XbCD by the corollary discharge (XeCD). To allow lateral (or alternatively feedback) interactions between the maps XbPC and XbCD, both must encode space in the same coordinate system. Thus, the corollary discharge must implicitly encode eye position information, as motivated by an observation of Cassanello and Ferrera (2007). For simplicity, we use the same eye position signal (XePC) to modulate corollary discharge from MD (and SC) with eye position. B, Time courses of the input signals for a 15 ms stimulus flash and a 12° saccade. Activities are shown for a Xr neuron tuned to the stimulus position (green), a XeCD neuron tuned to the saccade displacement (blue), and two XePC neurons tuned to presaccadic (black) and postsaccadic (red) eye positions. In Xr, neural latency (50 ms) and persistence are accounted for. During fixation, XePC encodes the eye position with a Gaussian of fixed width. Thirty-two milliseconds after saccade, the activity at the previous fixation starts to decay (after a brief rise) and increases at the same time at the postsaccadic eye position. Alignment to saccade offset is justified by Wang et al. (2007); however, alignment to saccade onset would also be possible. The CD is modeled by a Gaussian with a fixed spatial width, consistent with a previous modeling study (Hamker et al., 2008) and peaks 10 ms after saccade onset (Sommer and Wurtz, 2004). Its time course is modeled by a Gaussian as well using a different length for increase and decrease as suggested by cell recordings (Sommer and Wurtz, 2004). C, Activity of selected RBF neurons for a constant stimulus and a 12° saccade. Black, XbPC neuron with its receptive field (RF) center at the presaccadic stimulus position and sensitive to the initial eye position. Red, XbPC neuron with its RF located at the postsaccadic stimulus position and sensitive to the postsaccadic PC. Green, XbCD neuron with its RF located at the presaccadic stimulus position and sensitive to the CD for an eye displacement of 12°. Blue, XbCD neuron with its RF at the postsaccadic stimulus position and sensitive to the same CD. This XbCD shows predictive remapping since it responds to the stimulus at the postsaccadic position already before saccade. Gray area, Duration of the saccade. The insets illustrate from which neurons the simulated activities are. The vertical axes show retinotopic stimulus position; the horizontal axes show the craniotopic proprioceptive signal and the corollary discharge signal. Left inset, Recorded cells in the XbPC map. One neuron responds to stimuli in the presaccadic retinotopic position and is modulated by the presaccadic proprioceptive signal (black cross); the other responds to stimuli at the postsaccadic retinotopic position and is modulated by the postsaccadic proprioceptive signal (red cross). Right inset, Recorded cells in XbCD. One responds to the stimulus at the presaccadic retinotopic position (green cross), and the other, to the stimulus at the postsaccadic position (blue cross). Both are modulated by the CD signal.
Figure 2.
Figure 2.
The interactions of the layers. In each layer, a simplified version of the neurons equations is shown. Layer Xh is only present in the head-centered model. In layer Xr, “Stim” is the input from earlier areas and in Xr as well as in Xh; “S” is the synaptic depression. In all layers, “Gain” is the gain modulation factor. “PC” is the proprioceptive eye position signal, and “CD” is the corollary discharge signal. The retinal information is gain modulated in XbPC by the PC, which is by definition encoded in head-centered coordinates by the variable XePC. XbCD is gain modulated by XeFEF and furthermore receives additive input from Xr and feedback from Xh, which is also gain modulated by XeFEF.
Figure 3.
Figure 3.
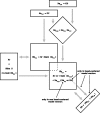
The decision process used in the model. The input signal that has to be decoded to yield a spatial position can either be the activity of the two simulated LIP layers XbPC and XbCD (in the non-head-centered model), or the activity of Xh (in the head-centered model). First, we apply a template matching for each time step. This has the advantage of increasing the spatial resolution by using appropriate precalculated templates. After that, noise is added so that not only the best matching template of each time step influences the final percept but the entire activity hill. These noisy template matches serve as input to accumulating decision neurons, which compete until a threshold is reached. We repeat the entire process 100 times to yield an average percept.
Figure 4.
Figure 4.
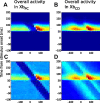
Activities of the two simulated LIP populations for 27° saccades depending on stimulus onset time relative to saccade onset (on the x-axis) and time after stimulus onset (y-axis), similar as in Bremmer et al. (2009). Each pixel shows the sum of activity across an entire neuron layer. Only one 15 ms flash is presented. A, Activities of XbPC. The activation pattern has the form of a horizontal bar that spans a time from 50 to 100 ms after stimulus onset, indicating that this layer consists of visually driven neurons. The horizontal bar shows a diagonal interruption due to perisaccadic suppression in this layer. The suppression appears diagonally since presaccadic stimuli are only suppressed in the later part of their activity trace, whereas stimuli presented around saccade offset are only suppressed in the early part of their activity trace. B, Activities of XbCD. It can be observed that this layer consists of visuomotor neurons. They are only active after a stimulus is presented; hence the overall pattern is also a horizontal bar. Different from XbPC neurons, activities here are modulated by corollary discharge; thus, they peak near saccade onset. Note that this layer also shows perisaccadic suppression, but only indirect via the lateral connections from XbPC. C, Same as A, but with uniform noise of zero mean added to the retinal input signal. Here, the diagonal of the perisaccadic suppression is well observable. D, Same as B, but with noise. Here, the diagonal activation that shows that this layer is also motor driven. Also, the suppression diagonal that stems from lateral connections can be seen, although it is weaker than in XbPC.
Figure 5.
Figure 5.
The experimental paradigm we simulate for perisaccadic shift in complete darkness. A, The spatial setup. Since misperceptions only occur parallel to the saccade direction, it is sufficient to simulate a one-dimensional world. In experiments, an elongated vertical bar is typically used. We simulate saccadic eye movements from fixation to saccade target. Stimulus flashes are presented at the fixation position, but neither our model nor experimental data show a strong dependence on flash position. In our simulations, as in the experiment of Van Wetter and Van Opstal (2008), we use four different saccade amplitudes (9, 14, 27, and 35°). B, The temporal setup. Flashes are presented at a variable time around the saccade between 180 ms before and 180 ms after saccade onset and with a varying duration (5, 15, or 50 ms).
Figure 6.
Figure 6.
Perisaccadic mislocalization in total darkness. A, Experimental data from Van Wetter and Van Opstal (2008) showing the localization error dependent on the time of the flash relative to saccade onset (saccade stimulus onset interval). The data show that the degree of mislocalization saturates with larger saccade amplitudes. B, C, Same as A, but from simulations with the non-head-centered and with the head-centered model. D, Dependency of the localization error on flash duration from the study by Van Wetter and Van Opstal (2008). E, F, Same as C, but from simulations with the non-head-centered and with the head-centered model.
Figure 7.
Figure 7.
Activity traces used as the input signal in the decision process for different saccade amplitudes. Flash time has been chosen to produce the maximum amount of mislocalization. Stimuli were flashed at saccade onset for 15 ms. The blue line (F) indicates the flash location. In the case of no mislocalization, the activity should be centered there. The green line indicates the saccade target that is the theoretical maximum amount of mislocalization.
Figure 8.
Figure 8.
Average of the activity traces from Figure 7 over 100 ms, which is the typical time until a perceptual decision is reached. Spatial position is normalized so that F and T are aligned for all saccade amplitudes. Activities are normalized to their maxima. The activity hill moves toward the fixation for higher saccade amplitudes, which explains the saturation effect.
Figure 9.
Figure 9.
Comparing the true eye position from the saccade generator (blue) with eye position signals decoded from network layers for a 9° saccade. The red and green lines are eye positions decoded from proprioceptive and CD influenced neurons, respectively. The black lines are decoded from both neuron types. The signal decoded from both neuron types starts to move presaccadically and is slower than the actual eye position.
Figure 10.
Figure 10.
A, Simulated eye position signals in case of a saccadic motor error. We here assume that the CD encodes the initially planned saccade target, whereas the proprioceptive signal encodes the actual landing point of the eye. If there is saccadic undershoot, the postsaccadic eye position signal and the CD will deviate. B, The influence of saccadic undershoot on peak mislocalizations as predicted by our model. For large saccade amplitudes, the localization error increases with larger motor errors.
Figure 11.
Figure 11.
Parameter variations of the timing of the eye position signals for perisaccadic shift and flash length dependency using the non-head-centered model. The illustrations to the left of each panel show signal timings. Shown are times in which the signals reach one-half of their respective maxima and in which the CD signal peaks. Timings of the CD signal are relative to saccade onset; those of the proprioceptive signal are relative to saccade offset. A, The standard parameters of our model, same as in Figure 6, B and E. C, Outcomes with the same parameter set but without a CD signal. It can be seen that the CD signal is essential in explaining early mislocalizations. B, D–L, Variations of the timing parameters of the CD and proprioceptive signals. The offset time of the presaccadic proprioceptive signal is responsible for the amount of negative mislocalization after saccade onset. The longer it is active, the stronger the negative mislocalizations are (E, G). The onset of the postsaccadic proprioceptive signal influences the peak mislocalization around saccade onset (I, K). The onset of the CD signal controls the time the earliest mislocalizations appear (F, H). The offset of the CD signal influences mislocalizations around saccade onset (J, L). Note that, contrary to the proprioceptive signal timing (E, K), the effect of CD offset varies with saccade amplitude, with the most pronounced effect on the 35° saccade. It also affects late mislocalizations beyond 100 ms after saccade onset. The dotted lines indicate the timing of parameters in A.
Figure 12.
Figure 12.
A later proprioception timing (offset and onset 50 ms later) combined with a weaker CD signal (by a factor of 0.4) results in a stronger negative mislocalization as it is reported by Jeffries et al. (2007) for a 14° saccade and 100 ms flash duration in a behavioral monkey study. The black dots are experimental data replotted from the study by Jeffries et al. (2007), their Figure 2a. The red line is model data.

Similar articles

Cited by

References

    1. Andersen RA, Bracewell RM, Barash S, Gnadt JW, Fogassi L. Eye position effects on visual, memory, and saccade-related activity in areas LIP and 7a of macaque. J Neurosci. 1990;10:1176–1196. - PMC - PubMed
    1. Bremmer F, Distler C, Hoffmann KP. Eye position effects in monkey cortex. II. Pursuit- and fixation-related activity in posterior parietal areas LIP and 7A. J Neurophysiol. 1997;77:962–977. - PubMed
    1. Bremmer F, Kubischik M, Hoffmann KP, Krekelberg B. Neural dynamics of saccadic suppression. J Neurosci. 2009;29:12374–12383. - PMC - PubMed
    1. Cassanello CR, Ferrera VP. Computing vector differences using a gain field-like mechanism in monkey frontal eye field. J Physiol. 2007;582:647–664. - PMC - PubMed
    1. Colby CL, Duhamel JR, Goldberg ME. Visual, presaccadic, and cognitive activation of single neurons in monkey lateral intraparietal area. J Neurophysiol. 1996;76:2841–2852. - PubMed

Publication types