. 2011 Nov 30;31(48):17514-26.
doi: 10.1523/JNEUROSCI.3127-11.2011.

Higher-order interactions characterized in cortical activity

Affiliations

Higher-order interactions characterized in cortical activity

Shan Yu et al. J Neurosci. .

Abstract

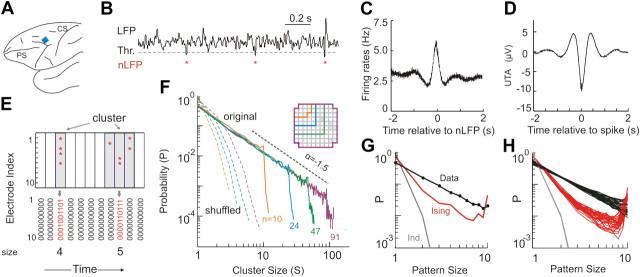
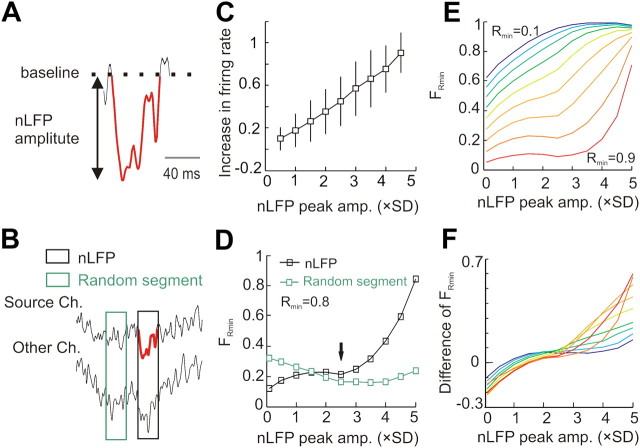
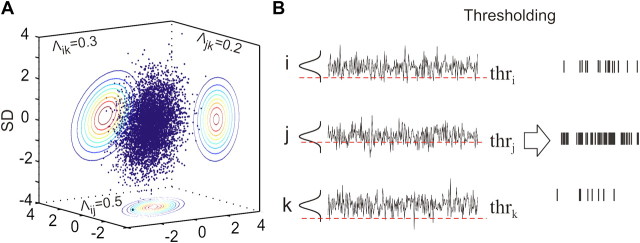
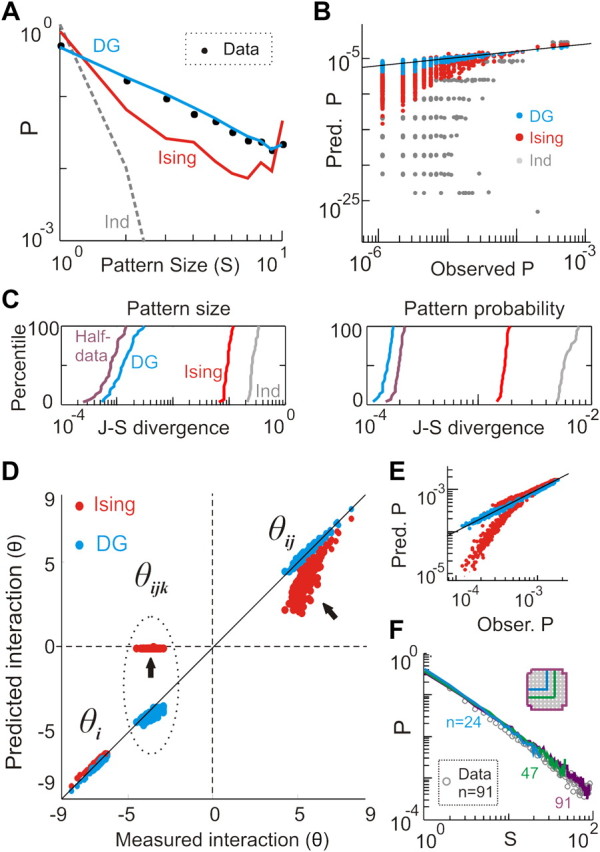
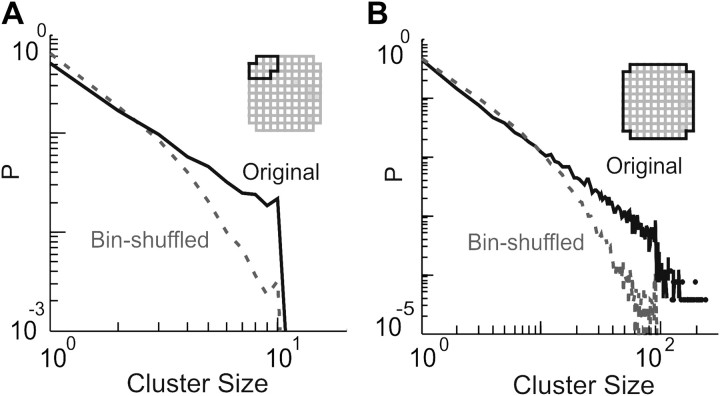
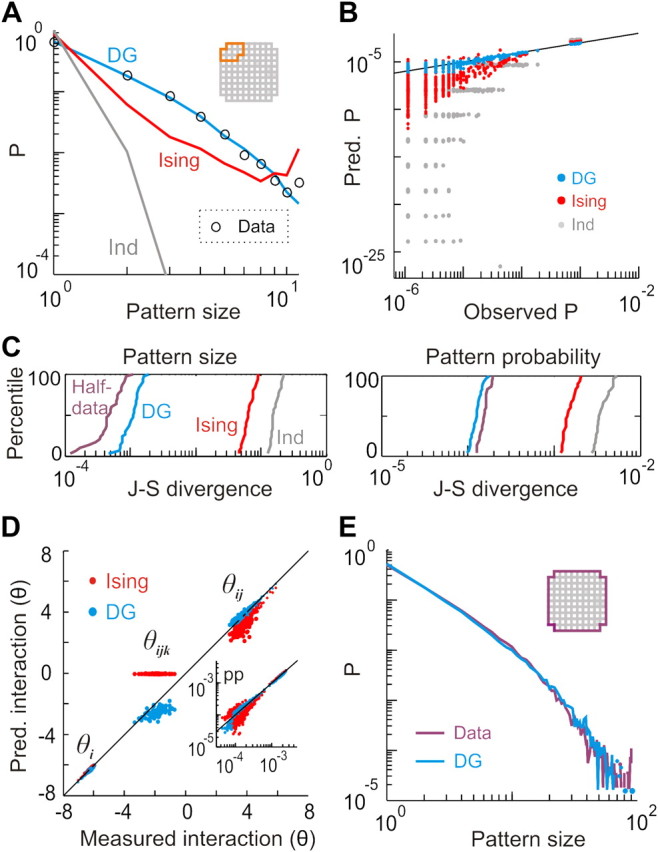
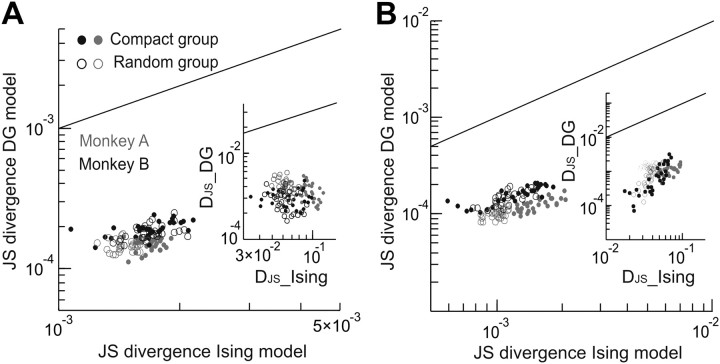
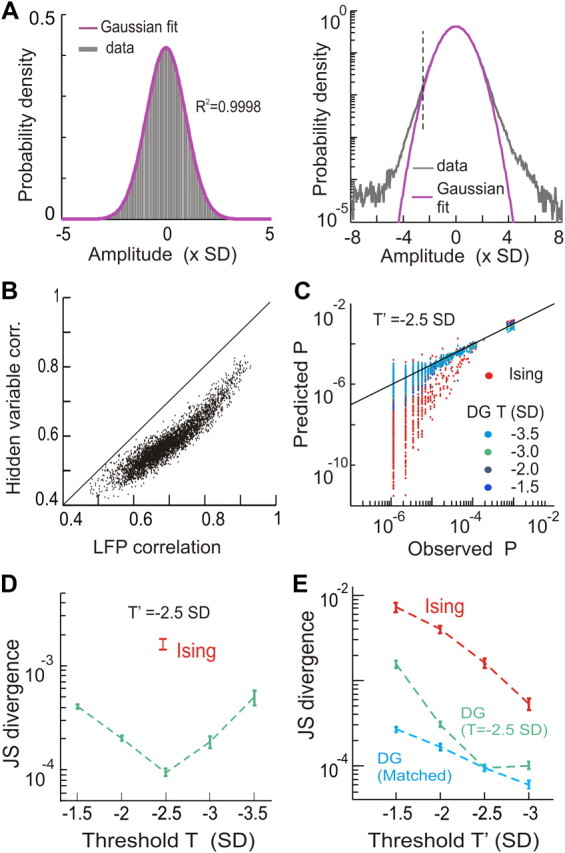
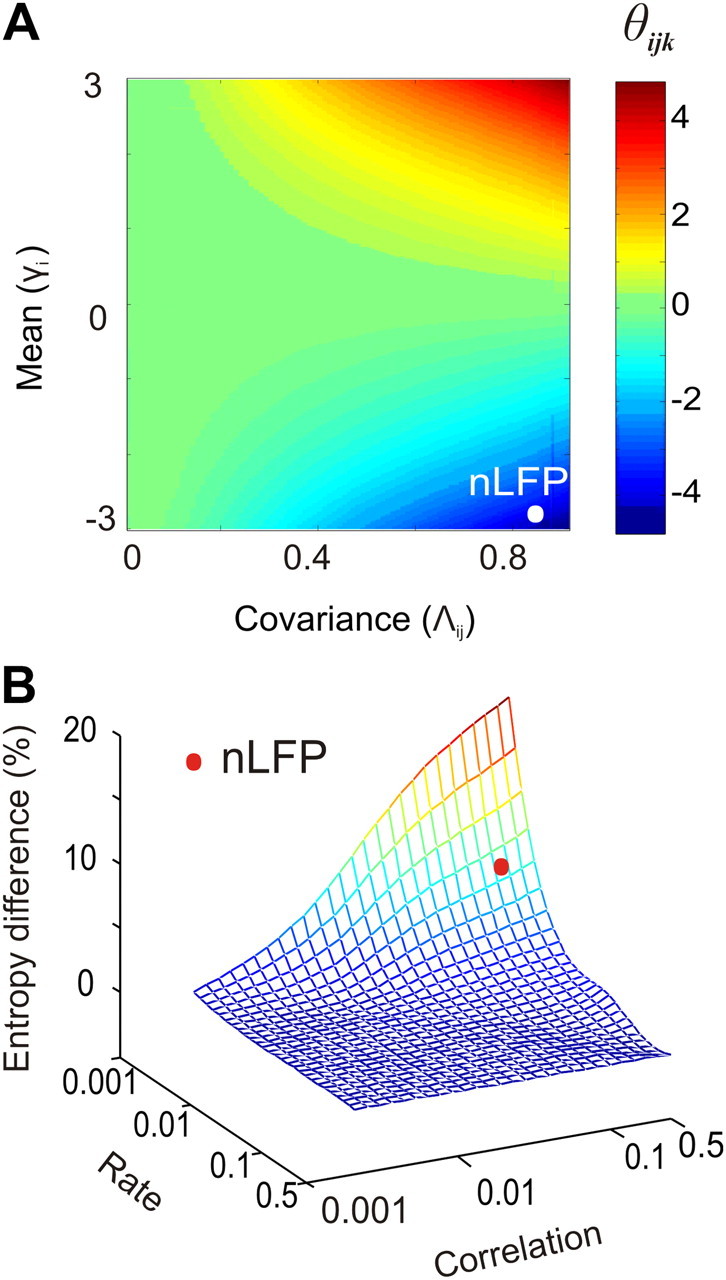
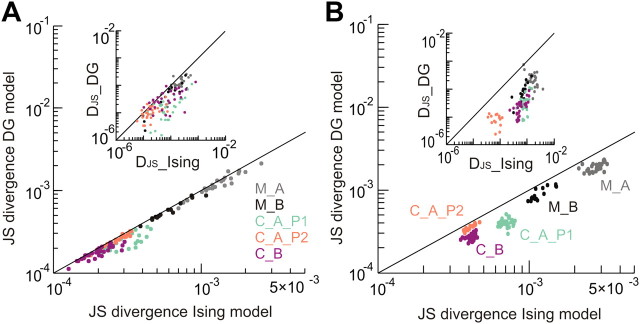
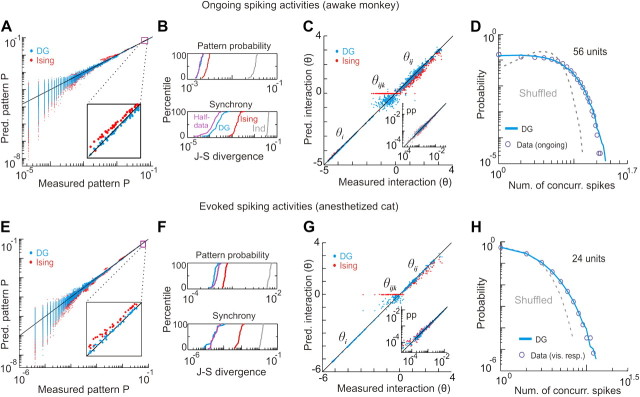
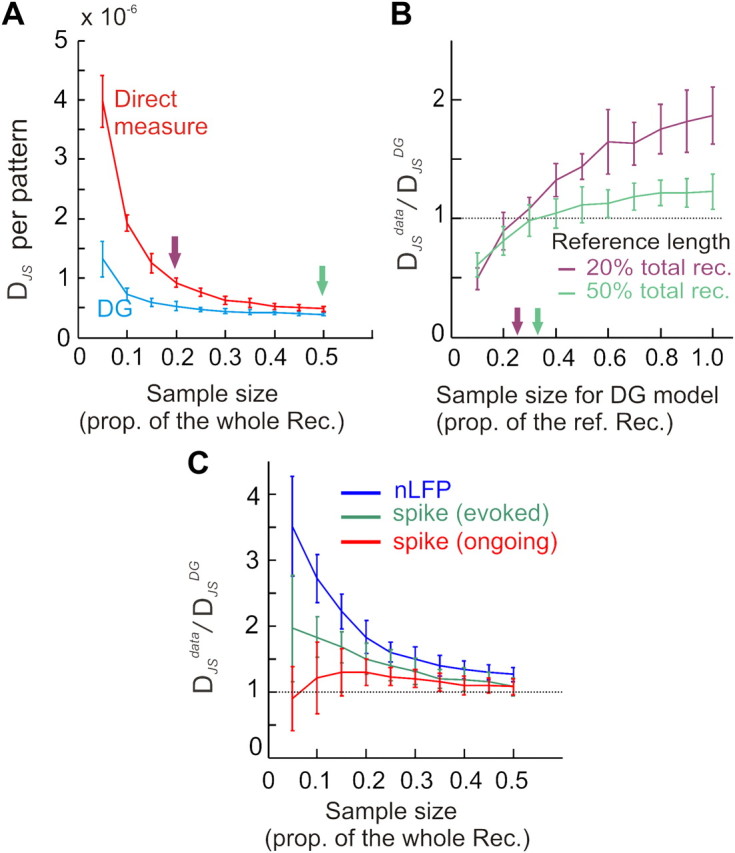
In the cortex, the interactions among neurons give rise to transient coherent activity patterns that underlie perception, cognition, and action. Recently, it was actively debated whether the most basic interactions, i.e., the pairwise correlations between neurons or groups of neurons, suffice to explain those observed activity patterns. So far, the evidence reported is controversial. Importantly, the overall organization of neuronal interactions and the mechanisms underlying their generation, especially those of high-order interactions, have remained elusive. Here we show that higher-order interactions are required to properly account for cortical dynamics such as ongoing neuronal avalanches in the alert monkey and evoked visual responses in the anesthetized cat. A Gaussian interaction model that utilizes the observed pairwise correlations and event rates and that applies intrinsic thresholding identifies those higher-order interactions correctly, both in cortical local field potentials and spiking activities. This allows for accurate prediction of large neuronal population activities as required, e.g., in brain-machine interface paradigms. Our results demonstrate that higher-order interactions are inherent properties of cortical dynamics and suggest a simple solution to overcome the apparent formidable complexity previously thought to be intrinsic to those interactions.


Figures

Figure 1.
Figure 1.
Power law organization of neuronal avalanches reflects higher-order interactions between locally synchronized neuronal groups. A, Lateral view of the macaque brain showing the position of the multi-electrode array (blue square) in premotor cortex (not to scale). PS, principal sulcus; CS, central sulcus. B, Example period of continuous LFP at a single electrode. Asterisks indicate peaks of negative deflections in the LFP (nLFP) that pass the threshold (Thr., broken line; −2.5 SD). C, The nLFP indicates periods of increased local unit activity. Average PETH of unit firing relative to peak nLFP time obtained for LFP and unit activity recorded at the same electrode (ongoing activity; bin width, 2 ms; n = 53 putative single units). D, The average LFP waveform turns negative around the time of unit firing. Unit-triggered average (UTA) of the LFP waveform (n = 53 units). Artifacts from spike waveform residuals due to incomplete LFP filtering were removed. E, Identification of spatiotemporal nLFP clusters and corresponding spatial patterns. nLFPs that occur in the same time bin or consecutive bins of length Δt define a spatiotemporal cluster; the size is given by its number of nLFPs (top; gray area, two clusters of size 4 and 5). Patterns represent the spatial information of clusters only (bottom). F, Neuronal avalanche dynamics are identified when the sizes of all clusters distribute according to a power law with a slope close of −1.5. Four distributions from the same original dataset (solid line) using different areas (inset), i.e., number of electrodes (n), are superimposed. The power law distributions vanish for shuffled data (broken lines). A theoretical power law with a slope of −1.5 is provided as guidance to the eye (gray broken line). G, The Ising model (red) fails to reconstruct the power law distribution of the 10-eletrode avalanche patterns obtained from the area indicated as orange in F. For comparison, the prediction when no interactions are assumed is also given (Independent model; Ind.). H, Corresponding analysis of avalanche patterns taken from 30 randomly chosen, spatially compact 10-eletrode groups of n = 91 electrodes (monkey A).
Figure 2.
Figure 2.
Coherence potential analysis suggests an intrinsic threshold in nLFP pattern formation. A, Coherence potential analysis utilizes the full baseline-to-baseline excursion of the nLFP waveform (red). B, The nLFP waveform at a source electrode is compared with the simultaneously recorded LFP at other electrodes (black rectangle). Similarities for each pairwise comparison are quantified by the Pearson correlation coefficient, r. Comparisons for randomly chosen, length-matched LFP segments from the source electrode serve as control (green rectangle). C, nLFP amplitude correlates with transient increase of local unit firing. Normalized increase of firing (see Materials and Methods) plotted as a function of nLFP amplitude (mean ± SD; n = 56 units). For all measured nLFP amplitudes, the increase of firing is significant (p ≪ 10−6; t test). D, Similarity in nLFP waveforms at distant sites increases nonlinearly with nLFP peak amplitude. Plotted are the fractions of electrodes on the array with high similarity r > 0.8, i.e., Rmin = 0.8, with the source electrode nLFP as a function of nLFP amplitude. Average increase in nLFP waveform similarity over all source channels (black; n = 91). Expectation in similarity for random comparisons (green). Threshold (−2.5 SD; arrow) used for nLFP detection in the current neuronal avalanche analysis. E, The nonlinear coherence potential function is revealed for high-similarity requirements, i.e., Rmin > 0.6. Coherence potential probability plotted as a function of minimal similarity r > Rmin (color coded). F, Difference between functions in E and expectation from random controls.
Figure 3.
Figure 3.
DG model. A, The distribution of a 3D Gaussian and its projections at individual 2D subspaces. Marginal distributions at a 2D space are represented by probability density contours. Λ, pairwise covariance. B, Converting continuous Gaussian variables to binary variables (events) by thresholding. Three Gaussian variables with pairwise covariance as specified in A and without higher-order interactions (left). Individual thresholds (thri, thrj, and thrk; broken lines) applied to each variable. The resulting trains of events, i.e., nLFPs or spikes, after thresholding (right). To fit the DG model to the data, the pairwise covariance (Λ) of the multidimensional continuous Gaussian and each threshold need to be adjusted such that the resulting binary variables have event rates and pairwise correlations identical to the data. We note that there is no direct correspondence between the threshold to extract nLFP patterns and the individual thresholds to adjust the rates of the binary variables.
Figure 4.
Figure 4.
The DG model accurately reconstructs neuronal avalanche dynamics and predicts second- and third-order interactions in neuronal avalanches significantly better than the Ising model. A, The DG model (blue) reconstructs the power law in size distribution for avalanche patterns (dots) more accurately than the Ising model (red). Results for data, Ising model, and Independent (Ind) model replotted from Figure 1G for comparison. B, The DG model is also superior in predicting the probabilities of avalanche patterns (corresponding data from A). Observed pattern probability P is plotted against model predictions. Solid line indicates equality. The most common pattern (all zeros; inactive) is not shown for visual clarity. C, Quantification of model prediction demonstrates 1–2 orders of magnitude in improvement of the DG model over the Ising model. Cumulative distribution of JS divergence between the observed and predicted size distribution of avalanche patterns for n = 30 randomly chosen, spatially compact 10-electrode groups (left; monkey A; compare Fig. 1H). Corresponding analysis for avalanche pattern probabilities (right). One-half of randomly chosen bins was used to predict the other half of data (half-data; see Materials and Methods) D, The DG model accurately predicts second- (θij) and third-order (θijk) interactions. In comparison, the Ising model is less accurate for second-order interactions (right arrow) and fails by design to predict third-order interactions (ellipsoid, arrow). Measured interactions of first to third order (θi, θij, and θijk, respectively) are plotted against model predictions for n = 98 randomly chosen 3-electrode groups (monkey A). E, Corresponding measured avalanche pattern probability plotted against model predictions (over all 3-electrode groups). Solid line indicates equality. F, The DG model accurately predicts the power law in the size distribution for avalanche patterns for systems much larger than 10 sites. Prediction for n = 24, 47, and 91 electrode sites are shown (compare Fig. 1F).
Figure 5.
Figure 5.
Demonstration of significant temporal correlations in avalanche dynamics. A–B, Size distribution for spatiotemporal clusters from bin-shuffled nLFPs (gray broken line) compared with the original avalanche size distribution (black solid line). For bin-shuffled data, temporal correlations beyond Δt, i.e., the duration of a single bin, are removed, which destroys the power law in cluster sizes. A, 10-electrode group. B, 91-electrode group. Insets, areas used for analysis.
Figure 6.
Figure 6.
The DG model accurately predicts instantaneous nLFP patterns. The dataset used in A–E are the same as in Figure 4A–F, and all analysis was performed in a corresponding way, except that activity patterns were based on instantaneous nLFP patterns found within a single bin of duration Δt, without further temporal concatenation into spatiotemporal clusters. For details, see Figure 4 legend.
Figure 7.
Figure 7.
Summary of the comparison between the DG and Ising models in approximating nLFP patterns for both monkeys. The DG model provides much more accurate predictions for both avalanche patterns (A) and instantaneous nLFP patterns (B) (monkey A, gray; monkey B, black). JS divergence of Ising model in predicting pattern probabilities is plotted against that of the DG model (10-electrode groups; spatially compact: filled circle, 30 groups; random chosen: unfilled circle, 30 groups). Solid line indicates equality. Insets: Results for approximating the size distribution of avalanche patterns (A) and instantaneous nLFP patterns (B).
Figure 8.
Figure 8.
Relation between LFP, instantaneous LFP patterns, and variables of the DG model. A, LFP amplitude distribution fitted by a Gaussian function. Whereas the fit seems good at linear scale (left), a clear deviation is visible for amplitudes larger than ±2–3 SD in semilogarithmic coordinates (right). −2.5 SD threshold (broken line). Example from single electrode. B, The pairwise correlation in the continuous LFP correlates with the pairwise correlation found for the corresponding hidden variables in the DG model (n = 91 electrodes; −2.5 SD nLFP threshold). Note the systematic, absolute difference in correlation between the hidden variables and corresponding LFP sites. Solid line, identity. C, Performance of the DG model when the covariances estimated at nLFP threshold T are used to predict nLFP patterns at threshold T′. Here T was varied from −1.5 to −3.5 SD to predict probability of nLFP patterns at T′ = −2.5 SD (an example 10-electrode group; solid line indicates equality). The predictions made by the Ising model (red) are provided for comparison. D, Quantification of results in C. JS divergence between the actual pattern probability distribution and that predicted by the DG model is plotted as a function of the threshold T to predict patterns at nLFP threshold T′ = −2.5 SD (mean ± SD; 30 10-electrode groups analyzed). Both matched (T = T′) and mismatched (TT′) DG models significantly outperform the (matched) Ising model. However, the mismatched DG models are significantly less accurate than the matched DG model. E, Covariance of the DG model constructed at threshold T = −2.5 SD is used to predict nLFP patterns obtained at T′ = [−1.5, −2, −2.5, −3 SD]. Results for the corresponding matched Ising and DG models are provided for comparison.
Figure 9.
Figure 9.
The magnitude of higher-order interactions introduced by thresholding depends on event rate and strength of pairwise correlations. A, Third-order interactions in the binary variables cannot be neglected if, for the Gaussian variable, the covariance is strong and the mean is far below or above 0. Change in the magnitude of third-order interaction (θijk) is shown as a function of the mean (γ) and the covariance (Λ) of an underlying 3D Gaussian, uN (γ, Λ). θijk was calculated for binary variables obtained by applying the threshold ui > 0. The white dot marks the average mean and covariance of the hidden Gaussians estimated in the DG model for nLFPs (Fig. 4D). B, Differences in pattern probabilities between the Ising and the DG models, here quantified as entropy difference, are most pronounced when, for the binary variables, the rate deviates far away from 0.5 (per bin) and pairwise correlations are strong, as is the case for avalanche patterns (high-rate regime produces a symmetric plot; data not shown). Entropy difference is plotted as a function of average rate and pairwise correlation. Dot (red) marks the average rate and pairwise correlation for avalanche patterns of monkey A (average of 91 channels and all pairs). For both A and B, simulations assume homogenous rate and pairwise correlations for simplicity.
Figure 10.
Figure 10.
Summary of the performance of the DG and the Ising models in approximating the spiking activity for all five datasets. A, The DG model provides more accurate predictions than the Ising model for both pattern probabilities and pattern sizes, i.e., neuronal synchrony defined as the number of concurrent active units (inset). JS divergence of the Ising model in predicting pattern probabilities and number of concurrent spikes plotted against those of the DG model (15–30 randomly chosen, 10-unit groups for individual datasets; M_A, monkey A; M_B, monkey B; C_A_P1, cat A, probe one; C_A_P2, cat A, probe two; C_B, cat B). B, Similar to A but for neuronal groups with strong pairwise correlations (see Materials and Methods for details about selection). Fifteen to 30 10-unit groups were analyzed for individual datasets. For both A and B, the performance differences between the two models were statistically significant (p ≪ 10−6 for all comparisons; signed rank test; data combined across all datasets).
Figure 11.
Figure 11.
For strongly coupled subgroups, the DG model predicts spiking activities in ongoing and stimulus-evoked conditions significantly better than the Ising model. A–C, Ongoing spiking activity during avalanche dynamics in monkey A. A, Predictions in pattern probability by DG and Ising models (30 10-unit groups with strongest pairwise correlation). Zoomed-in view, showing that the DG model more accurately predicted high probability patterns (inset). B, Cumulative distributions of JS divergence for the groups shown in A. C, Measured and predicted interactions for >200 three-unit groups with strongest pairwise correlation. Measured (x-axis) and predicted (y-axis) pattern probabilities (pp) for the same three-unit groups (inset). For more details, see legend of Figure 4B–D. D, Distribution of concurrent spikes for all 56 neurons recorded in monkey A (circles; ongoing activity) and prediction made by the DG model (line). The distribution for the shuffled data was plotted for comparison (dotted line). The shuffling was made for individual neurons and the total number of spikes as well as the distribution of interspike intervals was preserved. E–H, Corresponding results for spiking activity evoked by drifting gratings recorded in area 17 of an anesthetized cat (cat A, probe 1).
Figure 12.
Figure 12.
The DG model requires less data to characterize pattern probabilities compared with direct estimates. A, The DG model outperformed the direct sampling method in predicting pattern probabilities for nLFPs. Variably sized samples were drawn from 15 min of recording (training set) to predict pattern probability in another 15 min dataset (testing set). Performance quantified by average JS divergence per pattern in the testing set and plotted against the sample size taken from the training set. B, The DG model needs much less data to reach the same accuracy compared with direct sampling. Two reference recordings were chosen for the direct sampling method, 6 and 15 min in length, respectively (A, arrows). Then, various proportions of the reference recording were used for the DG model. The difference in performance of these two methods, measured by the ratio of JS divergence, was plotted against the amount of samples used by the DG model. The ratio of 1 (dotted line) indicates equal performance. Sample sizes to reach equal performance are marked by arrows. C, Sample size taken from the training set for both the nLFP and spiking activities plotted against the ratio of JS divergence. Almost all data points were significantly larger than 1 (signed rank test; p < 0.05), except for the first two points for ongoing spikes, which correspond to smallest sample sizes and, therefore, largest measurement errors. Total sample sizes were 9 × 10⁵, 9 × 10⁴, and 4.5 × 10⁵ for nLFP, ongoing spikes, and evoked spikes, respectively. Data are represented as mean ± SD. for all panels. Twenty randomly chosen 10-element groups for nLFP (monkey A), ongoing spikes (monkey A), and evoked spikes (cat A, probe 1) were analyzed.

Similar articles

Cited by

References

    1. Abeles M, Bergman H, Margalit E, Vaadia E. Spatiotemporal firing patterns in the frontal cortex of behaving monkeys. J Neurophysiol. 1993;70:1629–1638. - PubMed
    1. Amari S. Information geometry on hierarchy of probability distributions. IEEE Trans Inform Theory. 2001;47:1701–1711.
    1. Amari S, Nakahara H, Wu S, Sakai Y. Synchronous firing and higher-order interactions in neuron pool. Neural Comput. 2003;15:127–142. - PubMed
    1. Baum EB. What is thought? Cambridge: MA MIT; 2004. Chap 6.
    1. Beggs JM, Plenz D. Neuronal avalanches in neocortical circuits. J Neurosci. 2003;23:11167–11177. - PMC - PubMed

Publication types

LinkOut - more resources