. 2011 Nov 30;31(48):17590-602.
doi: 10.1523/JNEUROSCI.4065-11.2011.

Syntaxin1A lateral diffusion reveals transient and local SNARE interactions

Affiliations

Syntaxin1A lateral diffusion reveals transient and local SNARE interactions

Claire Ribrault et al. J Neurosci. .

Abstract

At the synapse, vesicles stably dock at the active zone. However, in cellular membranes, proteins undergo a diffusive motion. It is not known how the motion of membrane proteins involved in vesicle exocytosis is compatible with both vesicle docking and the dynamic remodeling of the plasma membrane imposed by cycles of exocytosis and endocytosis. To address this question, we studied the motion of the presynaptic membrane protein syntaxin1A at both the population and single-molecule levels in primary cultures of rat spinal cord neurons. Syntaxin1A was rapidly exchanged between synaptic and extrasynaptic regions. Changes in syntaxin1A mobility were associated with interactions related to the formation of the exocytotic complex. Finally, we propose a reaction-diffusion model reconciling the observed diffusive properties of syntaxin at the population level and at the molecular level. This work allows us to describe the diffusive behavior and kinetics of interactions between syntaxin1A and its partners that lead to its transient stabilization at the synapse.


Figures
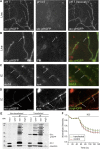
Figure 1.
Figure 1.
Expression of stx::pHGFP in spinal cord neurons. A, B, Live imaging of cultured spinal cord neurons (9 DIV) transfected with stx::pHGFP. A, Surface stx::pHGFP fluorescence was quenched by bath application of media at pH 4.5. B, Active synapses (arrows) were labeled with FM4-64 (FM4-64, red; stxGFP, green). C, Syntaxin-1A (stx1A) (green) and synapsin (syn) (red) IF labeling in nontransfected neurons (9 DIV). The arrows show patches of stx1A colocalizing with synapsin. D, Synapsin (Syn) (red) IF labeling in neurons transfected with stx::pHGFP (stxGFP;green). The arrows show patches of stx::pHGFP colocalizing with synapsin. Scale bar, 10 μm. E, Coimmunoprecipitation of SNAP-25 with stx::pHGFP and syntaxin1 in transfected and nontransfected PC12 cells. Starting material (input) and eluate from Immunobeads (IP) coupled to syntaxin1 (stx1), GFP, and control mouse IgG (mIgG) were analyzed by Western blotting with syntaxin1 antibody, revealing monomeric syntaxin1 and undissociated complexes (*), and SNAP-25 antibody, showing coimmunoprecipitation of SNAP-25 with endogenous syntaxin1 (lane 2) or stx::pHGFP (lane 7). MW, Molecular weight (in kilodaltons). F, Simultaneous destaining of FM4-64 from synaptic vesicles of nontransfected control cells (red) and stx::pHGFP expressing cells (green) in the same culture dishes, during 40 mm KCl application. The destaining rate is slightly lower in transfected cells than in nontransfected cells.
Figure 2.
Figure 2.
Slower rates of fluorescence recovery after photobleaching of stx::pHGFP at synaptic and extrasynaptic regions. A, Examples of images recorded during a FRAP experiment. Images of stx::pHGFP and synapses labeled with FM4-64 (FM) were taken before the bleaching (“prebleach”). The bleached area is indicated by a white circle on the corresponding overlay. Images from the time lapse recording following the bleaching are shown at times 0 s, 4 s, 28 s, and 3 min. B, Averaged normalized fluorescence recovery of stx::pHGFP (mean ± SEM) versus time at synaptic (red) and extrasynaptic (blue) regions. C, Parameters from the biexponential fit of the experimental curves (see Materials and Methods): short characteristic time τf, long characteristic time τs, and fast fraction Pf (mean ± SEM), for synaptic (red) and extrasynaptic (blue) regions. Two-tailed t test, **p < 0.01.
Figure 3.
Figure 3.
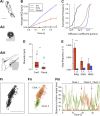
Lateral diffusion of stx::pHGFP coupled to QDs. A, Examples of trajectories of stx::pHGFP coupled to QDs. The motion can be Brownian (Ai), confined (Aii), or display a pause (Aiii and see text). The gray regions on Aii and Aiii correspond to synapses identified by FM4-64 labeling. Scale bar, 300 nm. B, Average MSD (±SEM) for synaptic (red) and extrasynaptic (blue) trajectories, and for pauses (black). C, Cumulative frequencies of the diffusion coefficients. The color code is the same as in B. The vertical dotted line indicates the threshold for quantum dots considered immobile, as measured on blank coverslips. D, Characteristic length of confinement at synapses (conf) and diameter of the area explored during pauses (median and 25–75% IQR, whiskers: 5 and 95% confidence limits). KS test, **p < 0.01. E, Frequencies (mean ± SEM) of the long, truncated (trunc), and short pauses, at synapses (red) or extrasynaptic regions (blue). Two-tailed Student's t test, ***p < 0.001. F, Example of a “subcompartmental” trajectory. Fi, Trajectory of a synaptic pause. Scale bar, 100 nm. Fii, Two Gaussian clusters of positions were identified by a Gaussian mixture analysis (see Materials and Methods) and are shown here in orange and green. Fiii, Distance of the QD to the center of each cluster (identified in Fii) as a function of time (cluster 1, orange; cluster 2, green). At first, the distance of the QD to the center of cluster 1 is very small compared with that of cluster 2, indicating that QD diffuses within cluster 1. Then, the QD moves to cluster 2 (arrow), as shown by the short distance to cluster 2 relative to cluster 1. Finally, it moves back to cluster 1 (arrow).
Figure 4.
Figure 4.
Effects of deletions of the Habc and SNARE domains on the lateral diffusion of stx::pHGFP. A, Schematic representation of the three constructs of syntaxin. The full-length construct consists of syntaxin1a (stx1a) fused to the pHGFP at its C-terminal end. The Habc domain is deleted in the SNARE construct (amino acids 1–28, 183–288), and both the Habc and the SNARE domains are deleted in the TMR construct (amino acids 1–28, 259–288). B, Average MSD (±SEM) for stx::pHGFP (solid lines), SNARE (dashed lines), and TMR (dotted lines) trajectories, at synaptic (red) or extrasynaptic (blue) regions. C, Cumulative frequencies of the diffusion coefficients. The color code is the same as in B. D, Frequencies (mean ± SEM) of the long, truncated, and short pauses, at synapses or extrasynaptic regions, and for each construct (stx::pHGFP, filled; SNARE, tight hatches; TMR, loose hatches). E, F, Averaged normalized fluorescence recovery (mean ± SEM) of stx::pHGFP (solid line), the SNARE construct (dashed line), and the TMR construct (dotted line) versus time, at synaptic (A) and extrasynaptic (B). The stars indicate the maximum p value measured at a given time point on the curve (see text for details). Two-tailed t test, *p < 0.05, *p < 0.001.
Figure 5.
Figure 5.
Effects of SNAP-25 cleavage on the lateral diffusion of stx::pHGFP. Neurons were transfected either with stx::pHGFP alone (control) or with both stx::pHGFP and the light chain of the BoNT/E, which specifically cleaves SNAP-25. A, Average MSD (±SEM) of trajectories of stx::pHGFP in control (solid lines) and BoNT/E (dotted lines) conditions, at synaptic (red) or extrasynaptic (blue) regions. B, Cumulative frequencies of the diffusion coefficients. The color and line codes are the same as in A. C, Frequencies (mean ± SEM) of the long, truncated, and short pauses, at synapses or extrasynaptic and for control (filled) and BoNT/E (hatches) conditions. D, Averaged normalized fluorescence recovery (±SEM) of stx::pHGFP in control cells (solid line) and in cells cotransfected with BoNT/E (dotted line) versus time, at synaptic (red) and extrasynaptic (blue) locations. The star indicates the maximum p value measured at a given time point on the curve (see text for details). Two-tailed t test, *p < 0.05.
Figure 6.
Figure 6.
Absence of effect of calcium chelation with the membrane permeant agent BAPTA-AM on the FRAP recovery. Averaged normalized fluorescence recovery (±SEM) of stxGFP in control conditions with only DMSO (solid line) and in the presence of BAPTA (dotted line) versus time, at synaptic (red) and extrasynaptic (blue) locations.
Figure 7.
Figure 7.
Simulations of FRAP with a model of two coupled binding reactions based on SPT data. A, Simulation of FRAP for the three different constructs (stx::pHGFP, green; SNARE, red; TMR, blue) at synaptic regions. Experimental data are shown in solid line, and simulated data, in dashed line. B, Simulation of FRAP for conditions with and without BoNT/E (control, green; BoNT/E, red) at synaptic regions. The line code is the same as in A.

Similar articles

Cited by

References

    1. Alcor D, Gouzer G, Triller A. Single-particle tracking methods for the study of membrane receptors dynamics. Eur J Neurosci. 2009;30:987–997. - PubMed
    1. Ashery U, Bielopolski N, Barak B, Yizhar O. Friends and foes in synaptic transmission: the role of tomosyn in vesicle priming. Trends Neurosci. 2009;32:275–282. - PMC - PubMed
    1. Bannai H, Lévi S, Schweizer C, Inoue T, Launey T, Racine V, Sibarita JB, Mikoshiba K, Triller A. Activity-dependent tuning of inhibitory neurotransmission based on GABAAR diffusion dynamics. Neuron. 2009;62:670–682. - PubMed
    1. Bowen ME, Weninger K, Ernst J, Chu S, Brunger AT. Single-molecule studies of synaptotagmin and complexin binding to the SNARE complex. Biophys J. 2005;89:690–702. - PMC - PubMed
    1. Calamai M, Specht CG, Heller J, Alcor D, Machado P, Vannier C, Triller A. Gephyrin oligomerization controls GlyR mobility and synaptic clustering. J Neurosci. 2009;29:7639–7648. - PMC - PubMed

Publication types

LinkOut - more resources