. 2011 Nov 30;31(48):17637-48.
doi: 10.1523/JNEUROSCI.4162-11.2011.

Alterations in intrinsic membrane properties and the axon initial segment in a mouse model of Angelman syndrome

Affiliations

Alterations in intrinsic membrane properties and the axon initial segment in a mouse model of Angelman syndrome

Hanoch Kaphzan et al. J Neurosci. .

Abstract

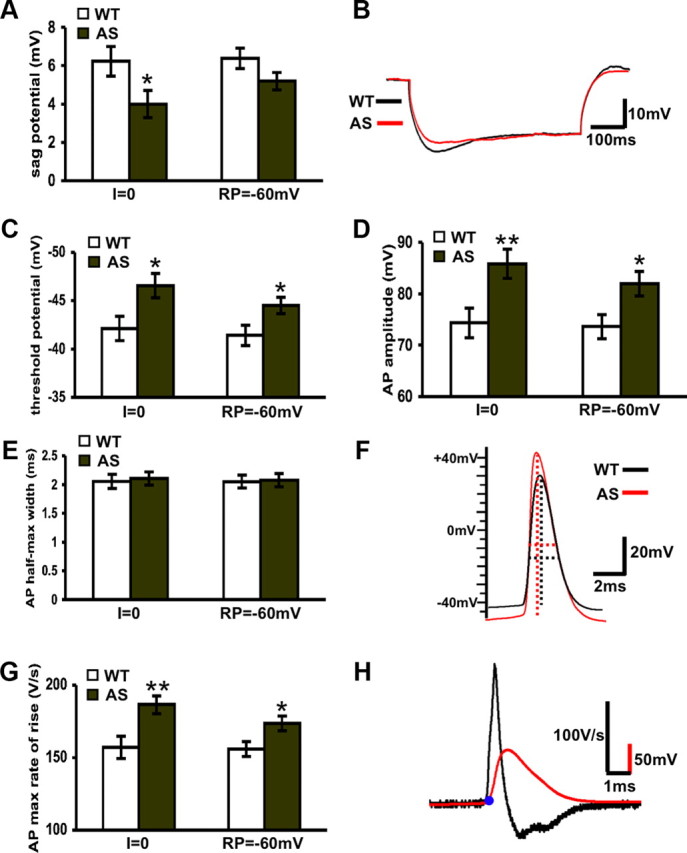
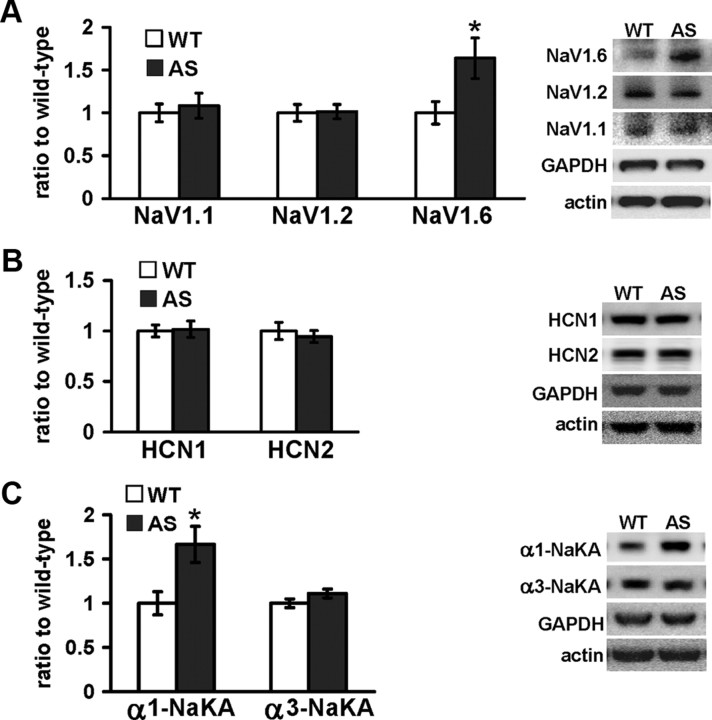
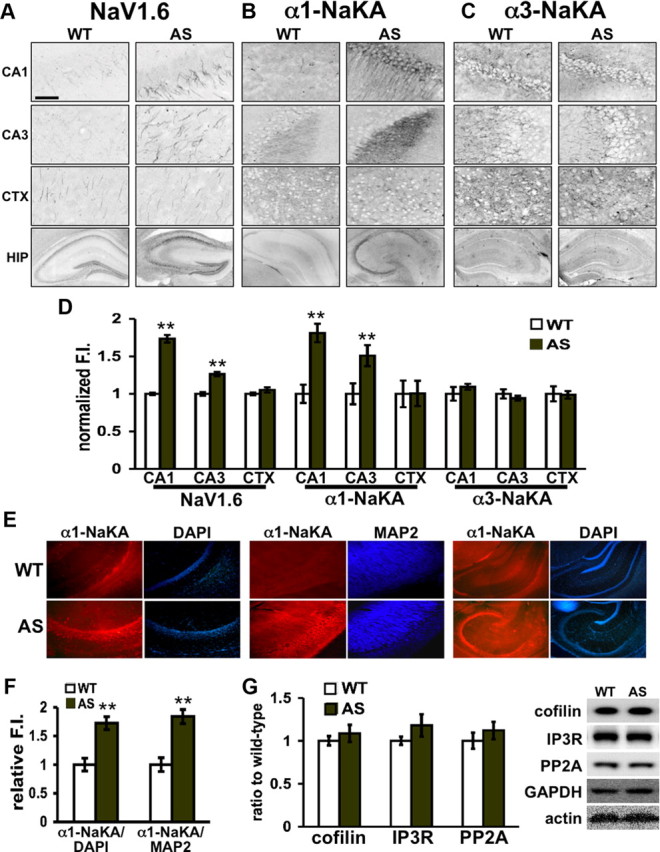
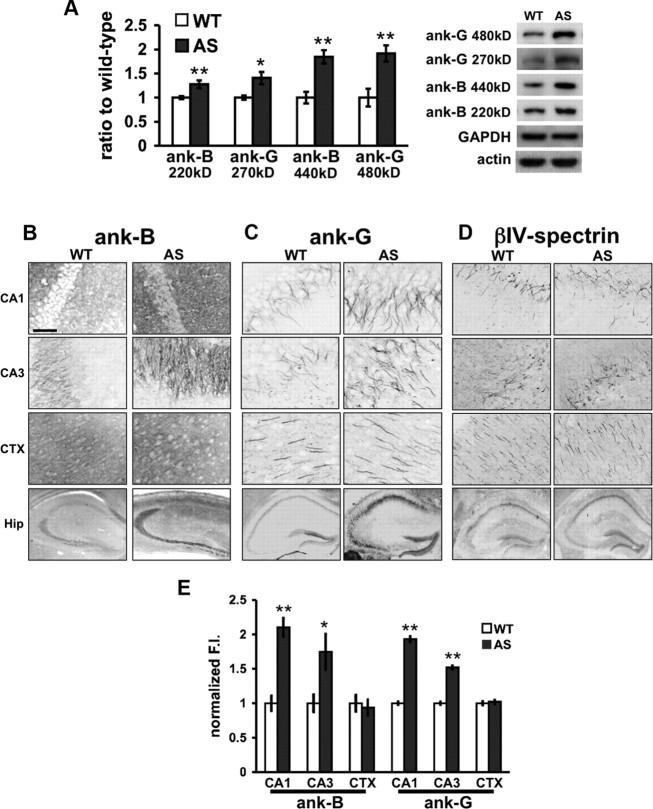
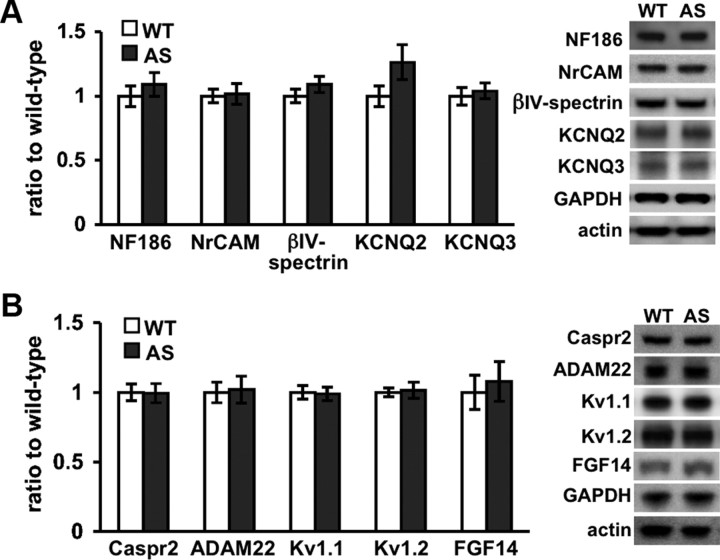
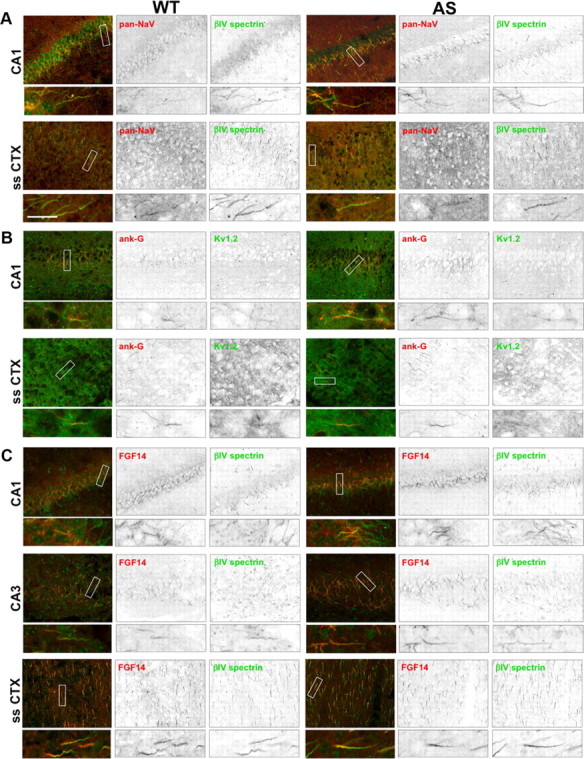
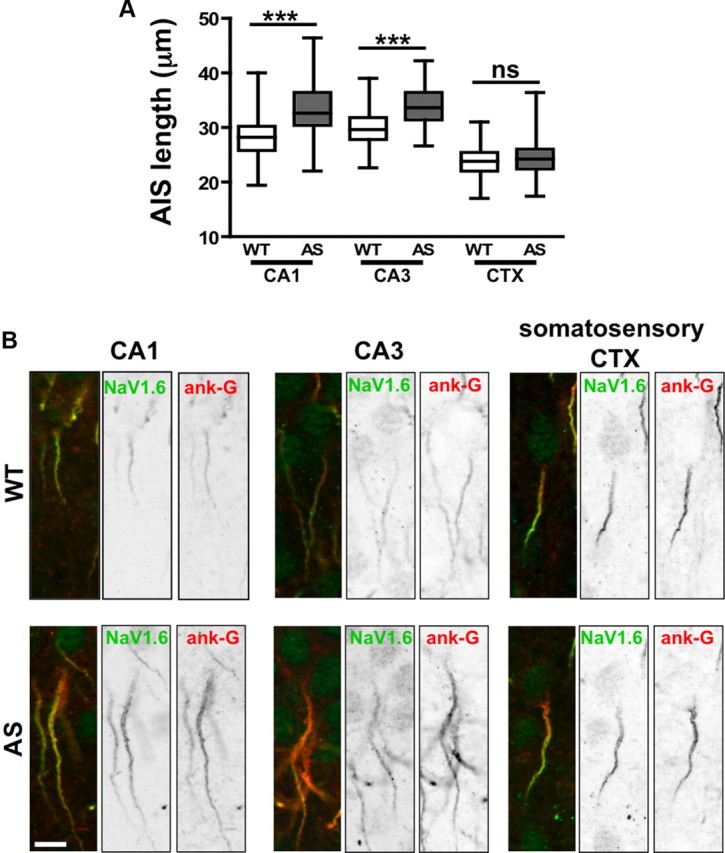
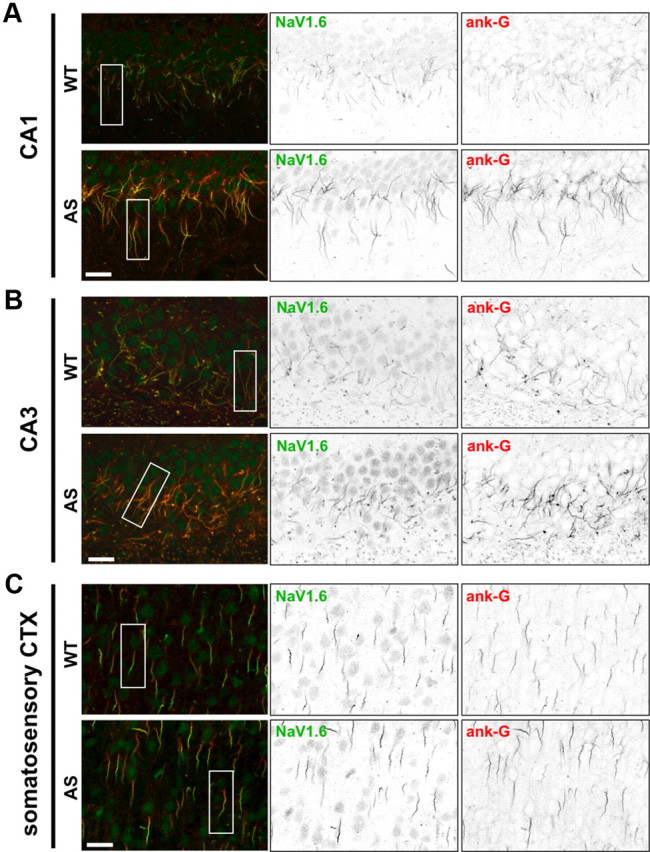
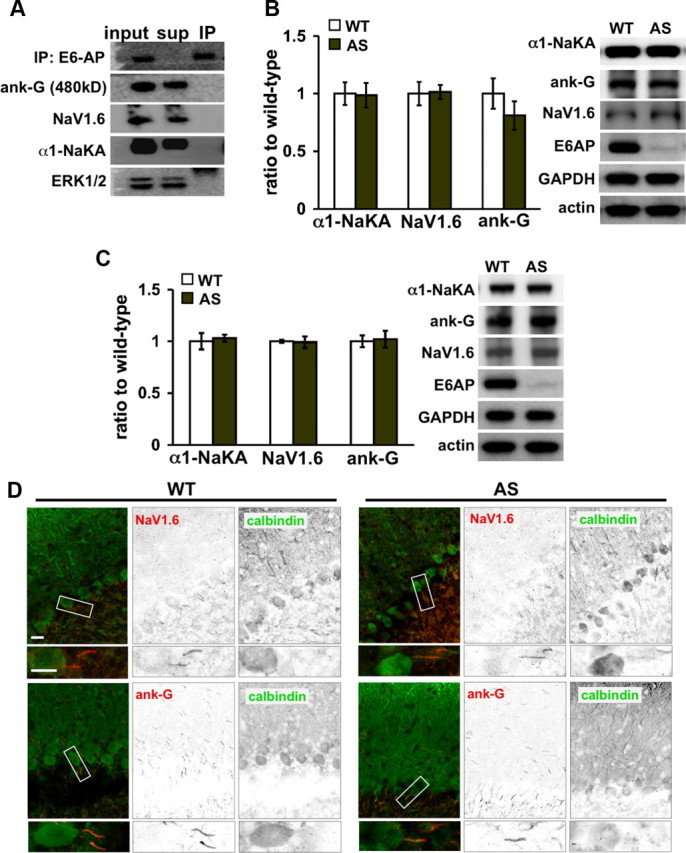
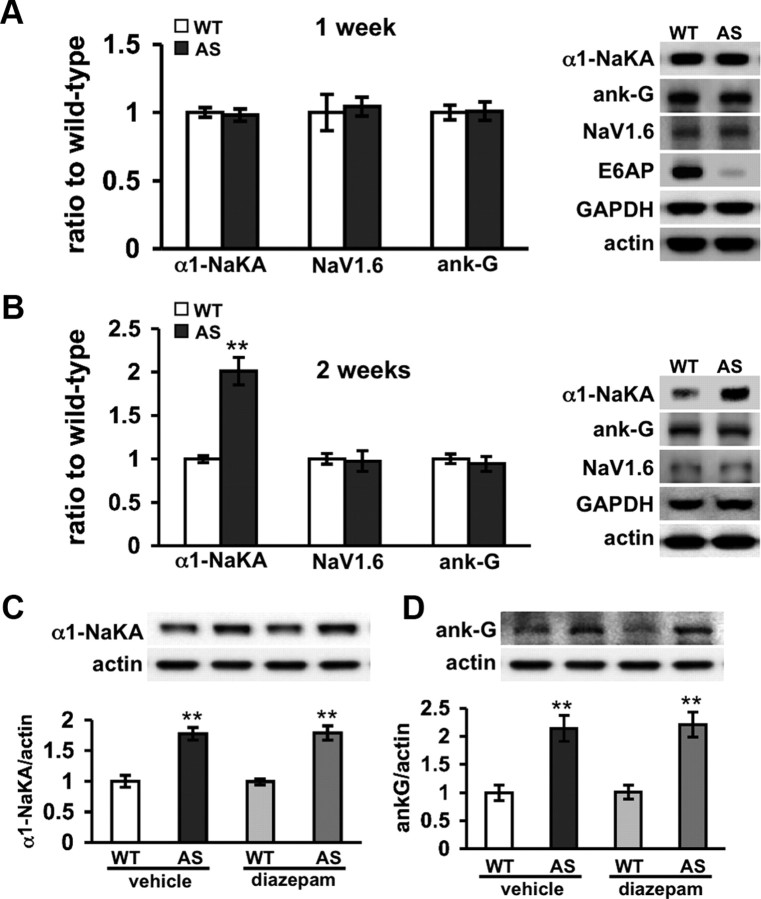
The axon initial segment (AIS) is the site of action potential initiation in neurons. Recent studies have demonstrated activity-dependent regulation of the AIS, including homeostatic changes in AIS length, membrane excitability, and the localization of voltage-gated Na(+) channels. The neurodevelopmental disorder Angelman syndrome (AS) is usually caused by the deletion of small portions of the maternal copy of chromosome 15, which includes the UBE3A gene. A mouse model of AS has been generated and these mice exhibit multiple neurological abnormalities similar to those observed in humans. We examined intrinsic properties of pyramidal neurons in hippocampal area CA1 from AS model mice and observed alterations in resting membrane potential, threshold potential, and action potential amplitude. The altered intrinsic properties in the AS mice were correlated with significant increases in the expression of the α1 subunit of Na/K-ATPase (α1-NaKA), the Na(+) channel NaV1.6, and the AIS anchoring protein ankyrin-G, as well as an increase in length of the AIS. These findings are the first evidence for pathology of intrinsic membrane properties and AIS-specific changes in AS, a neurodevelopmental disorder associated with autism.


Figures

Figure 1.
Figure 1.
Altered intrinsic properties in hippocampal CA1 pyramidal neurons from AS model mice and their wild-type littermates with either no current injection (I = 0) or constant current injection to bring the resting potential to −60 mV. A, Sag potential. B, Representative superimposed traces of sag potentials from wild-type (WT) and AS mice. C, Threshold potential. D, Action potential amplitude. E, Action potential full-width at half-maximum. F, Representative superimposed traces of action potentials from WT and AS mice. G, Maximal rate of rise (dV/dt) of the action potential. H, Sample of superimposed action potential trace from an AS mouse on its related dV/dt curve to illustrate the method for determining the threshold. Blue point is the projection of 30 V/s from the dV/dt curve on the action potential trace, which shows the deflection point of the threshold. (For all I = 0 experiments, WT: n = 15 cells, 5 mice; AS: n = 15 cells, 5 mice; for all current injection to the resting potential of −60 mV, WT: n = 18 cells, 5 mice; AS: n = 18 cells, 5 mice). Asterisks denote statistical significance (*p < 0.05; **p < 0.01) with a Student's t test.
Figure 2.
Figure 2.
Increased expression of NaV1.6 and α1-NaKA in AS model mice. A–C, Western blots of hippocampal homogenates from AS mice and their WT littermates were probed with antibodies to proteins potentially related to the altered intrinsic properties in the AS mice. Actin and GAPDH were used as loading controls and were quantified as a reference in the same blot for each protein. (WT: n = 9 mice; AS: n = 11 mice). * denotes statistical significance (p < 0.05) with a Student's t test.
Figure 3.
Figure 3.
Localization of the increased levels of NaV1.6 and α1-NaKA in AS model mice. A–C, IF scans of NaV1.6, α1-NaKA, and α3-NaKA respectively, in hippocampal areas CA1 and CA3, and the somatosensory cortex. The bottom frame in each column of all panels is an overview of the entire hippocampal region. Expression of NaV1.6 (A) and α1-NaKA (B) is increased in pyramidal neurons of hippocampal subregions CA1 and CA3, but not in the somatosensory cortex. C, α3-NaKA IF is similar between AS mice and WT littermates. Scale bar, 40 μm. D, Quantification of F.I. in the various subregions (WT and AS: n = 30–40 slices, 4 mice for NaV1.6; WT and AS: n = 7 slices, 4 mice for α1-NaKA; WT and AS: n = 12, 4 mice for α3-NaKA). E, IF of α1-NaKA in hippocampal area CA1 shows increase in the soma area (taken as a ratio to DAPI) and in the dendritic area (taken as a ratio to MAP2). The last two scans on the right side of each row is an overview of the entire hippocampal region. F, Quantification of F.I. results of relative α1-NaKA in the CA1 intracellular subregions (soma and dendrites). G, Western blot analysis of proteins that interact with α1-NaKA (cofilin, IP3R, and PP2A) from hippocampal homogenates shows no alterations in their expression in AS mice (WT: n = 9 mice; AS: n = 11 mice). ** denotes statistical significance (p < 0.01) with a Student's t test.
Figure 4.
Figure 4.
Increased expression of ankyrin-B and ankyrin-G in the hippocampus of AS model mice. A, Western blots of hippocampal homogenates from AS mice and their WT littermates were probed with antibodies to ankyrin-B and ankyrin-G (WT: n = 9 mice; AS: n = 11 mice). B, C, IF of ankyrin-B (B) and ankyrin-G (C) confirms that increased expression is in hippocampal subregions CA1 and CA3, but not the somatosensory cortex. Scale bar, 40 μm. D, IF scans of βIV-spectrin shows no alteration in the AIS of the hippocampus of AS mice. E, Quantification of F.I. results for ankyrin-B and ankyrin-G in the various subregions. (WT and AS: n = 6 slices, 4 mice). Asterisks denote statistical significance (*p < 0.05; **p < 0.01) with a Student's t test.
Figure 5.
Figure 5.
Expression of other AIS-related proteins are unaltered in AS model mice. A, B, Western blots of hippocampal homogenates from AS mice and their WT littermates were probed with antibodies to AIS-related proteins that interact with ankyrin-G (A) and other AIS-related proteins (B). Actin and GAPDH were used as loading controls and were quantified as a reference in the same blot for each protein. (WT: n = 9 mice; AS: n = 11 mice).
Figure 6.
Figure 6.
IF scans of other AIS-related proteins indicate no alterations in AS model mice. A–C, IF scans of hippocampal area CA1 and CA3, and the somatosensory cortex (ss CTX) probed for various AIS-related proteins show no change in AS model mice, except for NaVs (A) and ankyrin-G (B). The upper row is an overview scan of the specific region, and the lower row is a high resolution magnified scan of a specific AIS protein. Rectangles show the areas where the high-resolution AIS samples were taken from. Scale bar, 20 μm.
Figure 7.
Figure 7.
AIS in the hippocampus of AS mice is longer than in wild-type mice. A, AIS length was measured by tracking ankyrin-G IF, demonstrating a significant AIS lengthening in the AS mice of ∼18% and 13% in hippocampal areas CA1 and CA3 respectively. AIS length in the somatosensory cortex was unaltered (For CA1, WT: n = 126 cells, 4 mice; AS: n = 140 cells, 4 mice. For CA3, WT: n = 159 cells, 4 mice; AS: n = 159 cells, 4 mice. For somatosensory cortex, WT: n = 221 cells, 4 mice; AS: n = 223 cells, 4 mice.). *** denotes statistical significance (p < 0.001) with a Student's t test. B, High-resolution and -magnification sample IF scans of the AIS probed for NaV1.6 and ankyrin-G, in hippocampal areas CA1 and CA3, and the somatosensory cortex in AS mice and WT littermates. Scale bar, 5 μm.
Figure 8.
Figure 8.
Image sources for the AIS high-resolution scans. IF overview scans of hippocampal areas CA1 (A) and CA3 (B), and the somatosensory cortex (C) probed for NaV1.6 and ankyrin-G. Rectangles show the areas where the high-resolution AIS samples (Fig. 7B) were taken from. Scale bars, 20 μm.
Figure 9.
Figure 9.
Increased expression of α1-NaKA, NaV1.6 and ankyrin-G is not directly linked to E6-AP loss of function in AS mice. A, Coimmunoprecipitation experiments of hippocampal slices homogenates indicate that E6-AP does not interact with either α1-NaKA or ankyrin-G. Despite a good immunoprecipitation of E6-AP as can be seen in the immunoprecipitated fraction (IP), neither ankyrin-G nor α1-NaKA are present in that fraction, and they all stayed in the supernatant fraction (sup). All proteins are clearly seen in the homogenate before immunoprecipitation (input). B, C, Western blots of somatosensory cortical (B) and cerebellar (C) homogenates from AS mice and their WT littermates probed with antibodies to α1-NaKA, NaV1.6, ankyrin-G, and E6-AP (WT: n = 6 mice; AS: n = 6 mice). D, IF scans of cerebellar slices from AS mice and their WT littermates, probed for calbindin (as a reference), NaV1.6, and ankyrin-G.
Figure 10.
Figure 10.
Increased expression of α1-NaKA precedes that of NaV1.6 and ankyrin-G. A, Western blots of hippocampal homogenates from AS mice and their WT littermates at the age of 1 week, probed for α1-NaKA, NaV1.6, ankyrin-G, and E6-AP (WT: n = 7 mice; AS: n = 8 mice). B, Western blots of hippocampal homogenates from AS mice and their WT littermates at the age of 2 weeks, probed for α1-NaKA, NaV1.6 and ankyrin-G (WT: n = 7 mice; AS: n = 7 mice). C, D, α1-NaKA and ankyrin-G expression is not reversed by anti-epileptic chronic treatment. Western blots of hippocampal homogenates from AS mice and their WT given IP injections of either diazepam (12 mg/kg) or vehicle for 3 weeks, and then probed for α1-NaKA (C) and ankyrin-G (D) (n = 6 mice for each group) (p < 0.001 2-way ANOVA; ** denotes p < 0.01 for comparison of WT to AS in post hoc Bonferroni).

Similar articles

Cited by

References

    1. Albrecht U, Sutcliffe JS, Cattanach BM, Beechey CV, Armstrong D, Eichele G, Beaudet AL. Imprinted expression of the murine Angelman syndrome gene, Ube3a, in hippocampal and Purkinje neurons. Nat Genet. 1997;17:75–78. - PubMed
    1. Al-Mosalem OA, El-Ansary A, Attas O, Al-Ayadhi L. Metabolic biomarkers related to energy metabolism in Saudi autistic children. Clin Biochem. 2009;42:949–957. - PubMed
    1. Blaustein MP, Lederer WJ. Sodium/calcium exchange: its physiological implications. Physiol Rev. 1999;79:763–854. - PubMed
    1. Boda B, Dubos A, Muller D. Signaling mechanisms regulating synapse formation and function in mental retardation. Curr Opin Neurobiol. 2010;20:519–527. - PubMed
    1. Deng V, Matagne V, Banine F, Frerking M, Ohliger P, Budden S, Pevsner J, Dissen GA, Sherman LS, Ojeda SR. FXYD1 is an MeCP2 target gene overexpressed in the brains of Rett syndrome patients and Mecp2-null mice. Hum Mol Genet. 2007;16:640–650. - PubMed

Publication types