Visual pathway for the optokinetic reflex in infant macaque monkeys
- PMID: 22131426
- PMCID: PMC6623826
- DOI: 10.1523/JNEUROSCI.4302-11.2011
Visual pathway for the optokinetic reflex in infant macaque monkeys
Abstract
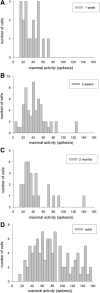
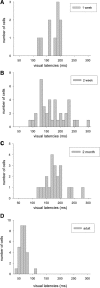
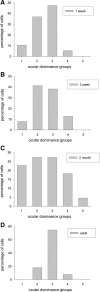
The horizontal optokinetic nystagmus (hOKN) in primates is immature at birth. To elucidate the early functional state of the visual pathway for hOKN, retinal slip neurons were recorded in the nucleus of the optic tract and dorsal terminal nucleus (NOT-DTN) of 4 anesthetized infant macaques. These neurons were direction selective for ipsiversive stimulus movement shortly after birth [postnatal day 9 (P9)], although at a lower direction selectivity index (DSI). The DSI in the older infants (P12, P14, P60) was not different from adults. A total of 96% of NOT-DTN neurons in P9, P12, and P14 were binocular, however, significantly more often dominated by the contralateral eye than in adults. Already in the youngest animals, NOT-DTN neurons were well tuned to different stimulus velocities; however, tuning was truncated toward lower stimulus velocities when compared with adults. As early as at P12, electrical stimulation in V1 elicited orthodromic responses in the NOT-DTN. However, the incidence of activated neurons was much lower in infants (40-60% of the tested NOT-DTN neurons) than in adults (97%). Orthodromic latencies from V1 were significantly longer in P12-P14 (x = 12.2 ± 8.9 ms) than in adults (x = 3.51 ± 0.81 ms). At the same age, electrical stimulation in motion-sensitive area MT was more efficient in activating NOT-DTN neurons (80% of the tested cells) and yielded shorter latencies than in V1 (x = 7.8 ± 3.02 ms; adult x = 2.99 ± 0.85 ms). The differences in discharge rate between neurons in the NOT-DTN contra- and ipsilateral to the stimulated eye are equivalent to the gain asymmetry between monocularly elicited OKN in temporonasal and nasotemporal direction at the various ages.
Figures


Similar articles
-
Callosal and superior temporal sulcus contributions to receptive field properties in the macaque monkey's nucleus of the optic tract and dorsal terminal nucleus of the accessory optic tract.J Comp Neurol. 1992 Jul 1;321(1):150-62. doi: 10.1002/cne.903210113. J Comp Neurol. 1992. PMID: 1377205
-
Responses of neurons of the nucleus of the optic tract and the dorsal terminal nucleus of the accessory optic tract in the awake monkey.Eur J Neurosci. 1996 Jan;8(1):92-105. doi: 10.1111/j.1460-9568.1996.tb01170.x. Eur J Neurosci. 1996. PMID: 8713453
-
Development of the optokinetic response in macaques: a comparison with cat and man.Ann N Y Acad Sci. 2003 Oct;1004:10-8. doi: 10.1196/annals.1303.002. Ann N Y Acad Sci. 2003. PMID: 14662443 Review.
-
Functional projections from striate cortex and superior temporal sulcus to the nucleus of the optic tract (NOT) and dorsal terminal nucleus of the accessory optic tract (DTN) of macaque monkeys.J Comp Neurol. 1991 Nov 22;313(4):707-24. doi: 10.1002/cne.903130413. J Comp Neurol. 1991. PMID: 1783687
-
Control of the optokinetic reflex by the nucleus of the optic tract in primates.Prog Brain Res. 1989;80:173-82; discussion 171-2. doi: 10.1016/s0079-6123(08)62211-6. Prog Brain Res. 1989. PMID: 2517458 Review.
Cited by
-
A direction-selective cortico-brainstem pathway adaptively modulates innate behaviors.Nat Commun. 2023 Dec 20;14(1):8467. doi: 10.1038/s41467-023-42910-2. Nat Commun. 2023. PMID: 38123558 Free PMC article.
-
The contrast sensitivity of the newborn human infant.Invest Ophthalmol Vis Sci. 2015 Jan 6;56(1):625-32. doi: 10.1167/iovs.14-14757. Invest Ophthalmol Vis Sci. 2015. PMID: 25564453 Free PMC article.
-
Development of the horizontal optocollic reflex in juvenile barn owls (Tyto furcata pratincola).J Comp Physiol A Neuroethol Sens Neural Behav Physiol. 2022 Jul;208(4):479-492. doi: 10.1007/s00359-022-01555-0. Epub 2022 Jun 13. J Comp Physiol A Neuroethol Sens Neural Behav Physiol. 2022. PMID: 35695937 Free PMC article.
-
Origins of direction selectivity in the primate retina.Nat Commun. 2022 May 23;13(1):2862. doi: 10.1038/s41467-022-30405-5. Nat Commun. 2022. PMID: 35606344 Free PMC article.
-
Global motion perception in 2-year-old children: a method for psychophysical assessment and relationships with clinical measures of visual function.Invest Ophthalmol Vis Sci. 2013 Dec 30;54(13):8408-19. doi: 10.1167/iovs.13-13051. Invest Ophthalmol Vis Sci. 2013. PMID: 24282224 Free PMC article.
References
-
- Abbott LF, Varela JA, Sen K, Nelson SB. Synaptic depression and cortical gain control. Science. 1997;275:220–224. - PubMed
-
- Armand J, Edgley SA, Lemon RN, Olivier E. Protracted postnatal development of corticospinal projections from the primary motor cortex to hand motoneurones in the macaque monkey. Exp Brain Res. 1994;101:178–182. - PubMed
-
- Asanuma H, Sakata H. Functional organisation of a cortical efferent system examined with focal depth stimulation in cats. J Neurophysiol. 1967;30:35–45.
-
- Atkinson J. Development of optokinetic nystagmus in the human infant and the monkey infant: an analogue to development in kittens. In: Freeman RD, editor. Developmental neurobiology of vision. New York: Plenum; 1979. pp. 277–287.
-
- Bachevalier J, Mishkin M. An early and a late developing system for learning and retention in infant monkeys. Behav Neurosci. 1984;98:770–778. - PubMed
Publication types
MeSH terms
LinkOut - more resources
Full Text Sources
Research Materials
