

Homeostatic strengthening of inhibitory synapses is mediated by the accumulation of GABA(A) receptors
- PMID: 22131430
- PMCID: PMC3396123
- DOI: 10.1523/JNEUROSCI.4476-11.2011
Homeostatic strengthening of inhibitory synapses is mediated by the accumulation of GABA(A) receptors
Abstract
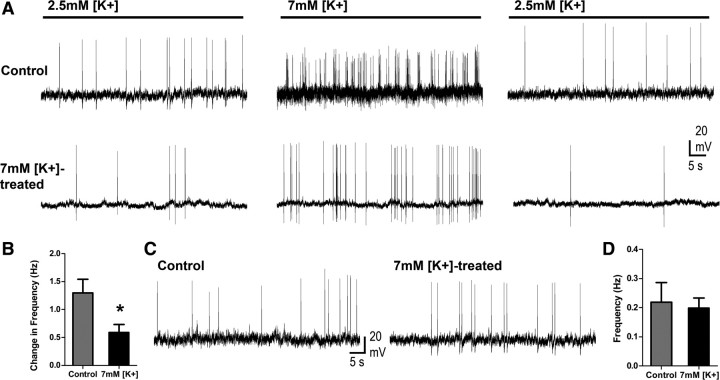
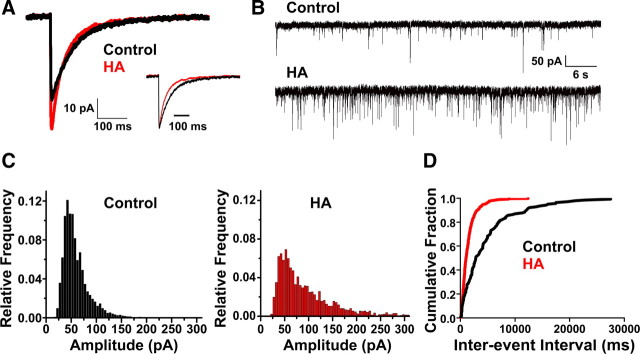
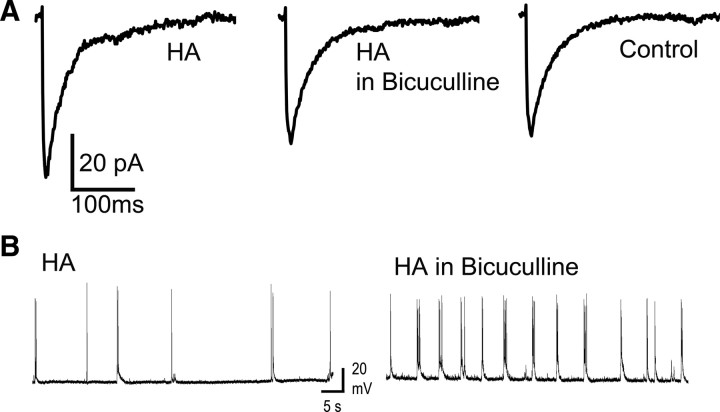
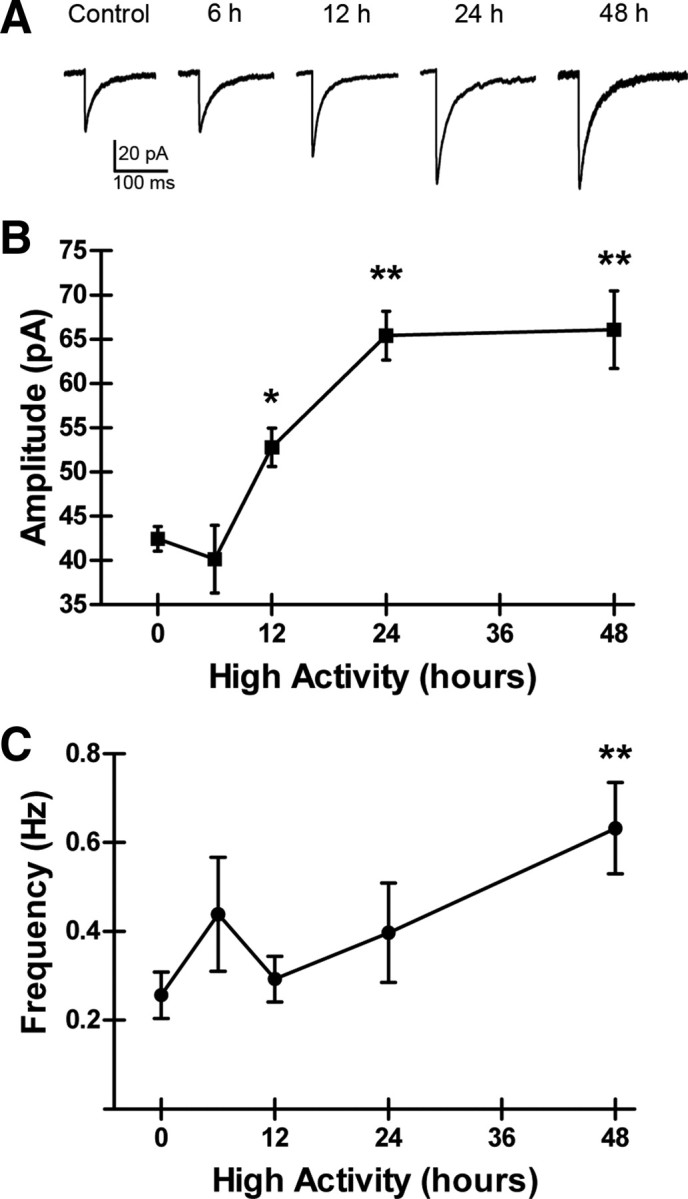
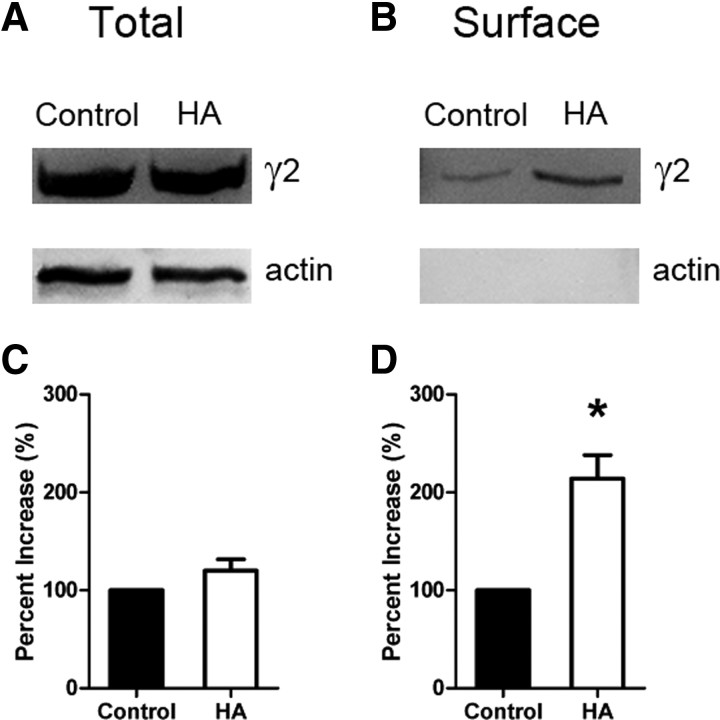
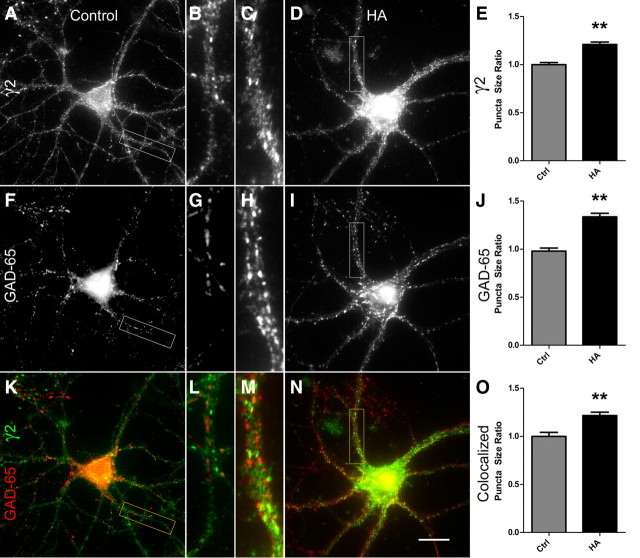
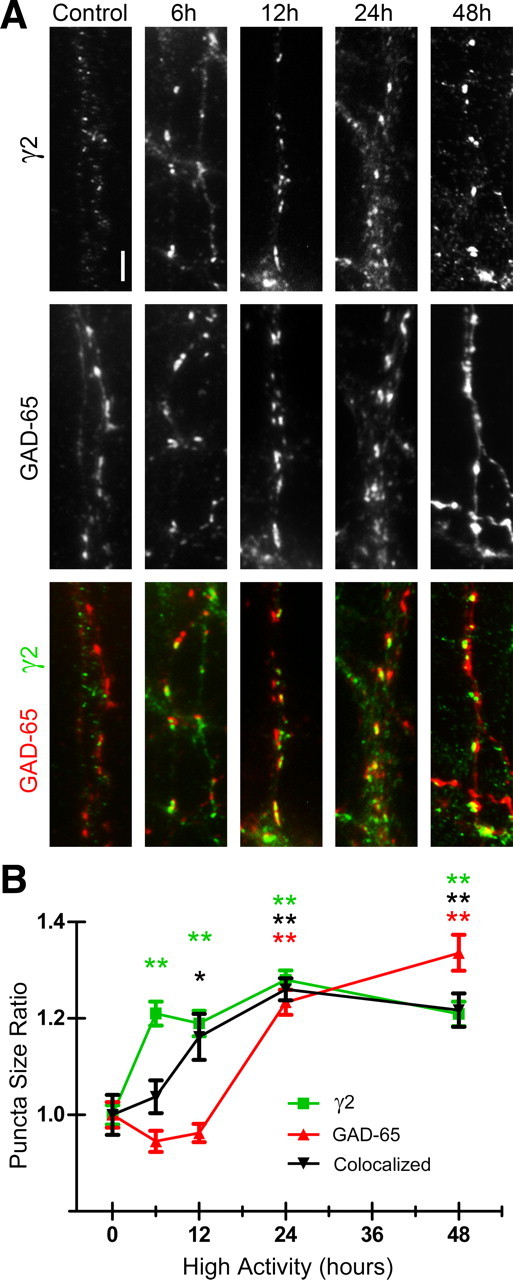
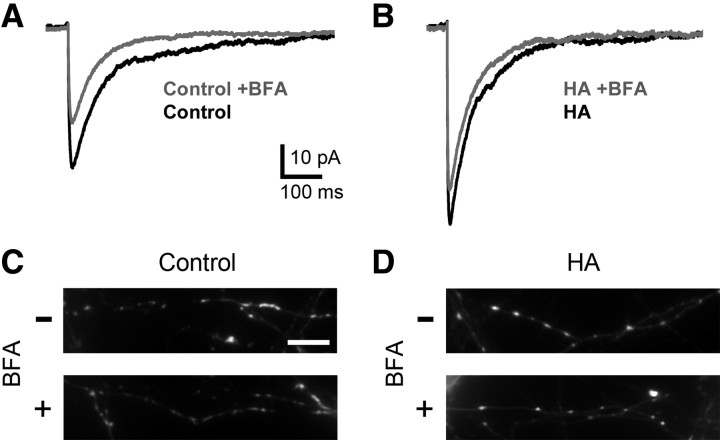
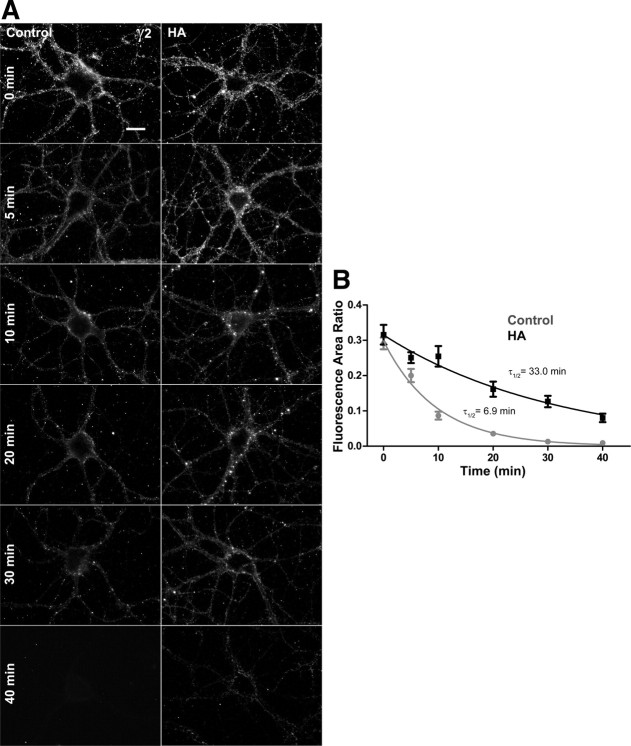
Mechanisms of homeostatic plasticity scale synaptic strength according to changes in overall activity to maintain stability in neuronal network function. This study investigated mechanisms of GABAergic homeostatic plasticity. Cultured neurons exposed to depolarizing conditions reacted with an increased firing rate (high activity, HA) that normalized to control levels after 48 h of treatment. HA-treated hippocampal neurons displayed an attenuated response to further changes in depolarization, and the firing rate in HA-treated neurons increased above normalized levels when inhibition was partially reduced back to the level of control neurons. The amplitude and frequency of mIPSCs in hippocampal neurons increased after 48 h of HA, and increases in the size of GABA(A) receptor γ2 subunit clusters and presynaptic GAD-65 puncta were observed. Investigation of the time course of inhibitory homeostasis suggested that accumulation of GABA(A) receptors preceded presynaptic increases in GAD-65 puncta size. Interestingly, the size of GABA(A) receptor γ2 subunit clusters that colocalized with GAD-65 were larger at 12 h, coinciding in time with the increase found in mIPSC amplitude. The rate of internalization of GABA(A) receptors, a process involved in regulating the surface expression of inhibitory receptors, was slower in HA-treated neurons. These data also suggest that increased receptor expression was consolidated with presynaptic changes. HA induced an increase in postsynaptic GABA(A) receptors through a decrease in the rate of internalization, leading to larger synaptically localized receptor clusters that increased GABAergic synaptic strength and contributed to the homeostatic stabilization of neuronal firing rate.
Figures
Similar articles
-
Postsynaptic spiking homeostatically induces cell-autonomous regulation of inhibitory inputs via retrograde signaling.J Neurosci. 2010 Dec 1;30(48):16220-31. doi: 10.1523/JNEUROSCI.3085-10.2010. J Neurosci. 2010. PMID: 21123568 Free PMC article.
-
Protracted postnatal development of inhibitory synaptic transmission in rat hippocampal area CA1 neurons.J Neurophysiol. 2000 Nov;84(5):2465-76. doi: 10.1152/jn.2000.84.5.2465. J Neurophysiol. 2000. PMID: 11067989
-
Inhibitory synaptic plasticity regulates pyramidal neuron spiking in the rodent hippocampus.Neuroscience. 2008 Jul 31;155(1):64-75. doi: 10.1016/j.neuroscience.2008.05.009. Epub 2008 May 21. Neuroscience. 2008. PMID: 18562122
-
GABAA receptor trafficking-mediated plasticity of inhibitory synapses.Neuron. 2011 May 12;70(3):385-409. doi: 10.1016/j.neuron.2011.03.024. Neuron. 2011. PMID: 21555068 Free PMC article. Review.
-
GABA(A) receptors, gephyrin and homeostatic synaptic plasticity.J Physiol. 2010 Jan 1;588(Pt 1):101-6. doi: 10.1113/jphysiol.2009.178517. Epub 2009 Sep 14. J Physiol. 2010. PMID: 19752109 Free PMC article. Review.
Cited by
-
miRNA-Dependent Control of Homeostatic Plasticity in Neurons.Front Cell Neurosci. 2019 Dec 5;13:536. doi: 10.3389/fncel.2019.00536. eCollection 2019. Front Cell Neurosci. 2019. PMID: 31866828 Free PMC article. Review.
-
Dystroglycan mediates homeostatic synaptic plasticity at GABAergic synapses.Proc Natl Acad Sci U S A. 2014 May 6;111(18):6810-5. doi: 10.1073/pnas.1321774111. Epub 2014 Apr 21. Proc Natl Acad Sci U S A. 2014. PMID: 24753587 Free PMC article.
-
Cochlear injury and adaptive plasticity of the auditory cortex.Front Aging Neurosci. 2015 Feb 5;7:8. doi: 10.3389/fnagi.2015.00008. eCollection 2015. Front Aging Neurosci. 2015. PMID: 25698966 Free PMC article. Review.
-
Reduced neurosteroid potentiation of GABAA receptors in epilepsy and depolarized hippocampal neurons.Ann Clin Transl Neurol. 2020 Apr;7(4):527-542. doi: 10.1002/acn3.51023. Epub 2020 Apr 3. Ann Clin Transl Neurol. 2020. PMID: 32243088 Free PMC article.
-
Estrogen Receptor-α in the Medial Amygdala Prevents Stress-Induced Elevations in Blood Pressure in Females.Hypertension. 2016 Jun;67(6):1321-30. doi: 10.1161/HYPERTENSIONAHA.116.07175. Epub 2016 Apr 18. Hypertension. 2016. PMID: 27091896 Free PMC article.
References
-
- Bannai H, Lévi S, Schweizer C, Inoue T, Launey T, Racine V, Sibarita JB, Mikoshiba K, Triller A. Activity-dependent tuning of inhibitory neurotransmission based on GABAAR diffusion dynamics. Neuron. 2009;62:670–682. - PubMed
-
- Benson DL, Watkins FH, Steward O, Banker G. Characterization of GABAergic neurons in hippocampal cell cultures. J Neurocytol. 1994;23:279–295. - PubMed
Publication types
MeSH terms
Substances
Grants and funding
LinkOut - more resources
Full Text Sources