. 2011 Nov;13(11):1019-25.
doi: 10.1593/neo.111252.

Detection of somatic copy number alterations in cancer using targeted exome capture sequencing

Affiliations

Detection of somatic copy number alterations in cancer using targeted exome capture sequencing

Robert J Lonigro et al. Neoplasia. 2011 Nov.

Abstract

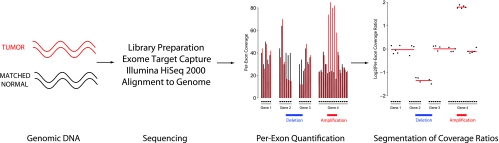
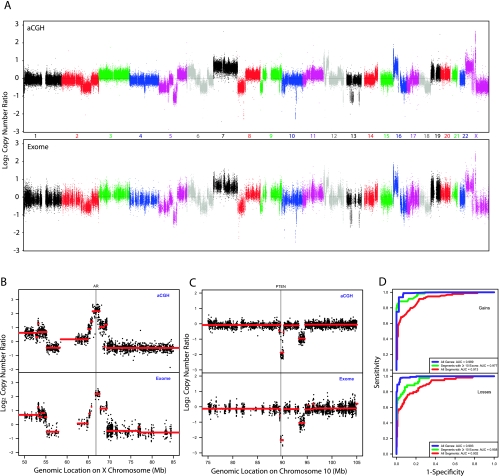
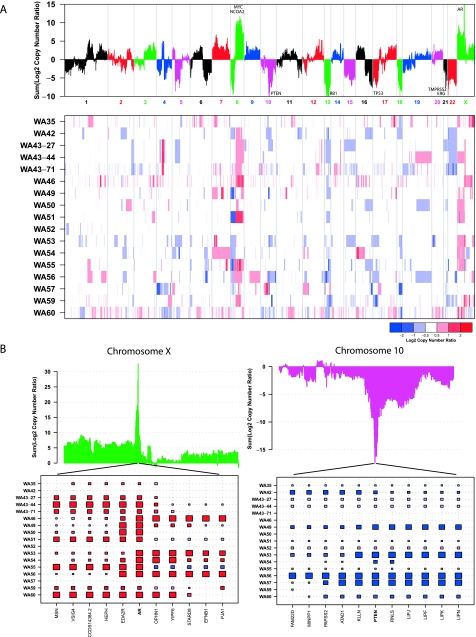
The research community at large is expending considerable resources to sequence the coding region of the genomes of tumors and other human diseases using targeted exome capture (i.e., "whole exome sequencing"). The primary goal of targeted exome sequencing is to identify nonsynonymous mutations that potentially have functional consequences. Here, we demonstrate that whole-exome sequencing data can also be analyzed for comprehensively monitoring somatic copy number alterations (CNAs) by benchmarking the technique against conventional array CGH. A series of 17 matched tumor and normal tissues from patients with metastatic castrate-resistant prostate cancer was used for this assessment. We show that targeted exome sequencing reliably identifies CNAs that are common in advanced prostate cancer, such as androgen receptor (AR) gain and PTEN loss. Taken together, these data suggest that targeted exome sequencing data can be effectively leveraged for the detection of somatic CNAs in cancer.


Figures

Figure 1
Figure 1
Overview of copy number analysis by whole exome sequencing. Vertical bars represent per-exon coverage in the tumor (red) and matched normal (black) tissue. Log-transformed coverage ratios between tumor and normal tissues are computed for each exon (black dots) and altered regions are identified through segmentation analysis (red line segments).
Figure 2
Figure 2
Comparison of exome sequencing to array CGH in detecting CNAs. (A) Overall copy number across the genome for metastatic prostate tumor sample WA54 by aCGH (upper panel) and exome sequencing (lower panel). Log2(copy number ratio) between tumor and matched normal is shown on the vertical axis; each point represents the log-transformed ratio for each aCGH probe or targeted exon, ordered by genomic coordinates. (B) Copy number assessment for sample WA54 by aCGH and exome sequencing in a 35-Mb region containing the AR gene. Red line segments represent segmented copy number data. (C) Copy number assessment for sample WA54 by aCGH and exome sequencing in a 30-Mb region containing the PTEN gene. Red line segments represent segmented copy number data. (D) Classification performance of exome capture sequencing relative to aCGH for sample WA54. ROC curves are shown, using aCGH copy number assessments as a criterion standard. ROC curves are presented for classifying all aCGH segments (red), segments containing at least 10 targeted exons (green), and all targeted genes (blue).
Figure 3
Figure 3
Qualitative comparison to prior CNAs observed in prostate cancer. (A) Overall summary of copy number across 17 lethal metastatic castration-resistant prostate cancers. Summed segmented log2 copy number ratios (top panel) for all targeted genes across the 17 samples are shown. Genes exhibiting recurrent amplifications or deletions across the cohort will have large positive or negative values, respectively. Regions of copy number gain and loss for all 17 samples are shown in a heat map (bottom panel). Red represents amplification; white, copy number neutral; blue, deletion. Three samples are derived from three different metastatic foci from a man with lethal castrate-resistant prostate cancer: celiac lymph node metastatic site (WA43-27), lung metastatic site (WA43-71), and bladder metastatic site (WA43-44). (B) Focal amplifications of the AR gene and deletions of the PTEN gene in this cohort. AR has the largest positive summed log copy number ratio across the 17 samples, with a total sum of 32.6, whereas PTEN has the largest negative summed log copy number ratio, with a total sum of -17.5. A plot of this sum over the entire chromosome (top) is shown; a large positive peak is present at AR and a large negative peak is present at PTEN. Segmented copy number ratios are represented by boxes, with the area (absolute log2 ratio) and color intensity (log2 ratio; copy number gain in red; loss in blue) of each box proportional to mean copy number across that gene. Missing boxes indicate that the gene is neither amplified nor deleted in that sample.

References

    1. Pinkel D, Seagraves R, Sudar D, Clark S, Poole I, Kowbel D, Collins C, Kuo WL, Chen C, Zhai Y, et al. High resolution analysis of DNA copy number variation using comparative genomic hybridization to microarrays. Nat Genet. 1998;20:207–211. - PubMed
    1. Sebat J, Lakshmi B, Troge J, Alexander J, Young J, Lundin P, Månér S, Massa H, Walker M, Chi M, et al. Large-scale copy number polymorphism in the human genome. Science. 2004;305:525–528. - PubMed
    1. Sharp AJ, Locke DP, McGrath SD, Cheng Z, Bailey JA, Vallente RU, Pertz LM, Clark RA, Schwartz S, Seagraves R, et al. Segmental duplications and copy-number variation in the human genome. Am J Hum Genet. 2005;77:78–88. - PMC - PubMed
    1. Carter NP. Methods and strategies for analyzing copy number variation using DNA microarrays. Nat Genet. 2007;39:S16–S21. - PMC - PubMed
    1. McCarroll SA, Kuruvilla FG, Korn JM, Cawley S, Nemesh J, Wysoker A, Shapero MH, deBakker PI, Maller JB, Kirby A, et al. Integrated detection and population-genetic analysis of SNPs and copy number variation. Nat Genet. 2008;40:1166–1174. - PubMed

Publication types