

Does reduced IGF-1R signaling in Igf1r+/- mice alter aging?
- PMID: 22132081
- PMCID: PMC3223158
- DOI: 10.1371/journal.pone.0026891
Does reduced IGF-1R signaling in Igf1r+/- mice alter aging?
Abstract
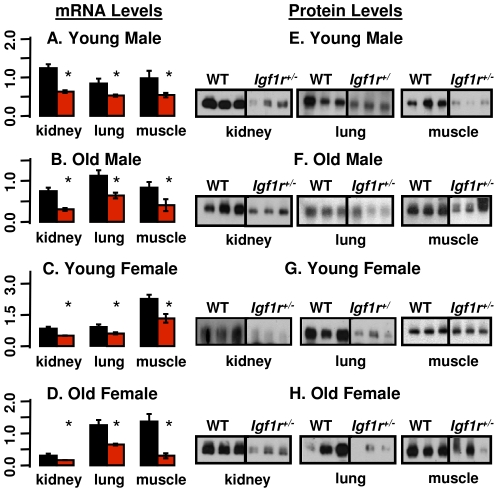
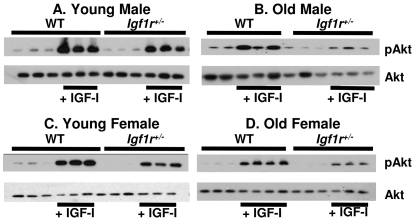
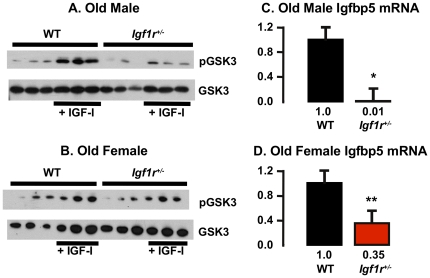
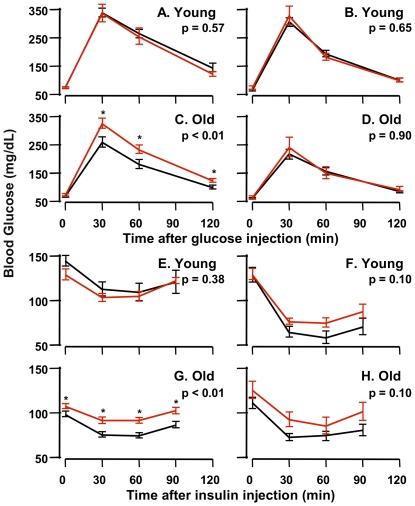
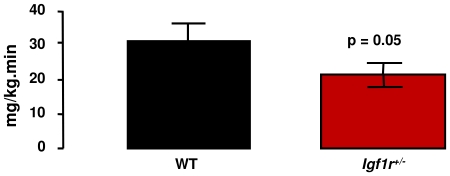
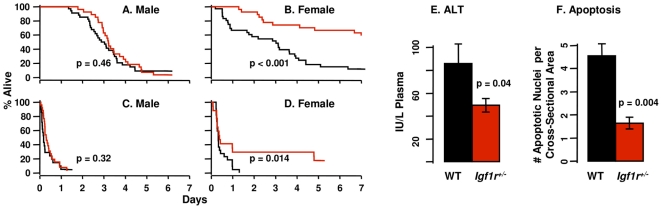
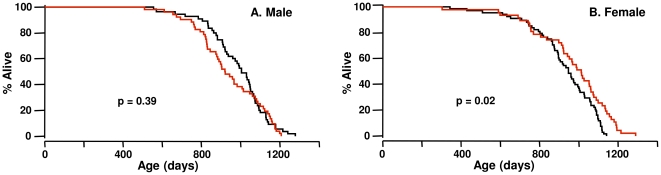
Mutations in insulin/IGF-1 signaling pathway have been shown to lead to increased longevity in various invertebrate models. Therefore, the effect of the haplo-insufficiency of the IGF-1 receptor (Igf1r(+/-)) on longevity/aging was evaluated in C57Bl/6 mice using rigorous criteria where lifespan and end-of-life pathology were measured under optimal husbandry conditions using large sample sizes. Igf1r(+/-) mice exhibited reductions in IGF-1 receptor levels and the activation of Akt by IGF-1, with no compensatory increases in serum IGF-1 or tissue IGF-1 mRNA levels, indicating that the Igf1r(+/-) mice show reduced IGF-1 signaling. Aged male, but not female Igf1r(+/-) mice were glucose intolerant, and both genders developed insulin resistance as they aged. Female, but not male Igf1r(+/-) mice survived longer than wild type mice after lethal paraquat and diquat exposure, and female Igf1r(+/-) mice also exhibited less diquat-induced liver damage. However, no significant difference between the lifespans of the male Igf1r(+/-) and wild type mice was observed; and the mean lifespan of the Igf1r(+/-) females was increased only slightly (less than 5%) compared to wild type mice. A comprehensive pathological analysis showed no significant difference in end-of-life pathological lesions between the Igf1r(+/-) and wild type mice. These data show that the Igf1r(+/-) mouse is not a model of increased longevity and delayed aging as predicted by invertebrate models with mutations in the insulin/IGF-1 signaling pathway.
Conflict of interest statement
Figures
References
-
- Tatar M, Bartke A, Antebi A. The endocrine regulation of aging by insulin-like signals. Science. 2003;299:1346–1351. - PubMed
-
- Klass M. A method for the isolation of longevity mutants in the nematode Caenorhabditis elegans and initial results. Mechanisms of Ageing and Development. 1983;22:279–286. - PubMed
-
- Riddle DL. The Nematode Caenorhabditis elegans. Cold Spring Harbor, N.Y.: Cold Spring Harbor Laboratory; 1988. The Dauer Larva. pp. 393–414.
-
- Morris JZ, Tissenbaum HA, Ruvkun G. A phosphatidylinositol-3-OH kinase family member regulating longevity and diapause in Caenorhabditis elegans. Nature. 1996;382:536–539. - PubMed
-
- Kimura KD, Tissenbaum HA, Liu Y, Ruvkun G. daf-2, an insulin receptor-like gene that regulates longevity and diapause in Caenorhabditis elegans 7. Science. 1997;277:942–946. - PubMed
Publication types
MeSH terms
Substances
Grants and funding
- T32 AG021890/AG/NIA NIH HHS/United States
- R01 DK024092/DK/NIDDK NIH HHS/United States
- P01 AG019316/AG/NIA NIH HHS/United States
- P30 AG013319/AG/NIA NIH HHS/United States
- DK-80157/DK/NIDDK NIH HHS/United States
- R01AG026012/AG/NIA NIH HHS/United States
- AG-26557/AG/NIA NIH HHS/United States
- DK-24092/DK/NIDDK NIH HHS/United States
- DK-089229/DK/NIDDK NIH HHS/United States
- AG-13319/AG/NIA NIH HHS/United States
- 1P30-AG-13319/AG/NIA NIH HHS/United States
- R37 AG026557/AG/NIA NIH HHS/United States
- R01 AG023843/AG/NIA NIH HHS/United States
- K23 AG030979/AG/NIA NIH HHS/United States
- R01 AG026012/AG/NIA NIH HHS/United States
- AG-23843/AG/NIA NIH HHS/United States
- AG-19316/AG/NIA NIH HHS/United States
- R01 DK089229/DK/NIDDK NIH HHS/United States
- AG-030979/AG/NIA NIH HHS/United States
- R01 DK080157/DK/NIDDK NIH HHS/United States
- AGO-21890/PHS HHS/United States
- R56 DK024092/DK/NIDDK NIH HHS/United States
LinkOut - more resources
Full Text Sources
Other Literature Sources
Medical
Molecular Biology Databases
Miscellaneous
