

Resistance patterns selected by nevirapine vs. efavirenz in HIV-infected patients failing first-line antiretroviral treatment: a bayesian analysis
- PMID: 22132100
- PMCID: PMC3223170
- DOI: 10.1371/journal.pone.0027427
Resistance patterns selected by nevirapine vs. efavirenz in HIV-infected patients failing first-line antiretroviral treatment: a bayesian analysis
Abstract
Background: WHO recommends starting therapy with a non-nucleoside reverse transcriptase inhibitor (NNRTI) and two nucleoside reverse transcriptase inhibitors (NRTIs), i.e. nevirapine or efavirenz, with lamivudine or emtricitabine, plus zidovudine or tenofovir. Few studies have compared resistance patterns induced by efavirenz and nevirapine in patients infected with the CRF01_AE Southeast Asian HIV-subtype. We compared patterns of NNRTI- and NRTI-associated mutations in Thai adults failing first-line nevirapine- and efavirenz-based combinations, using bayesian statistics to optimize use of data.
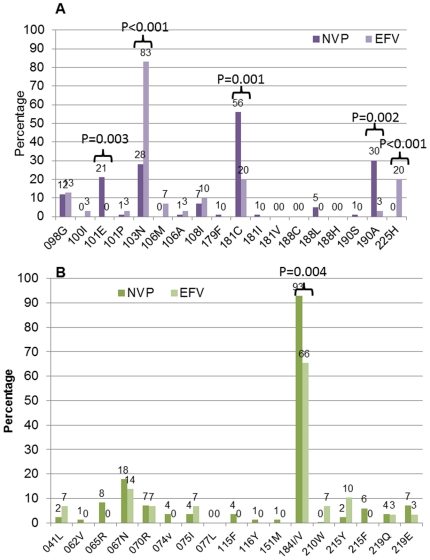
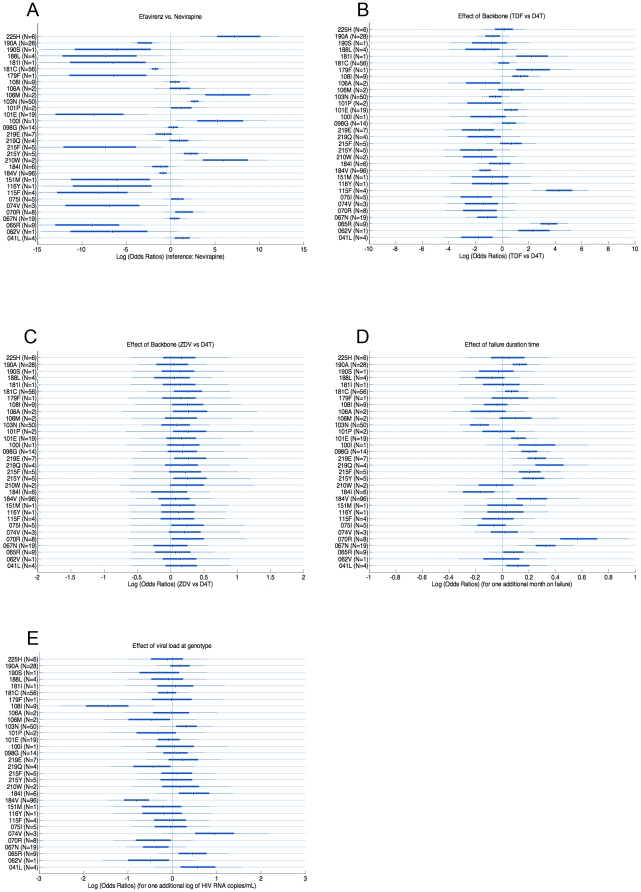
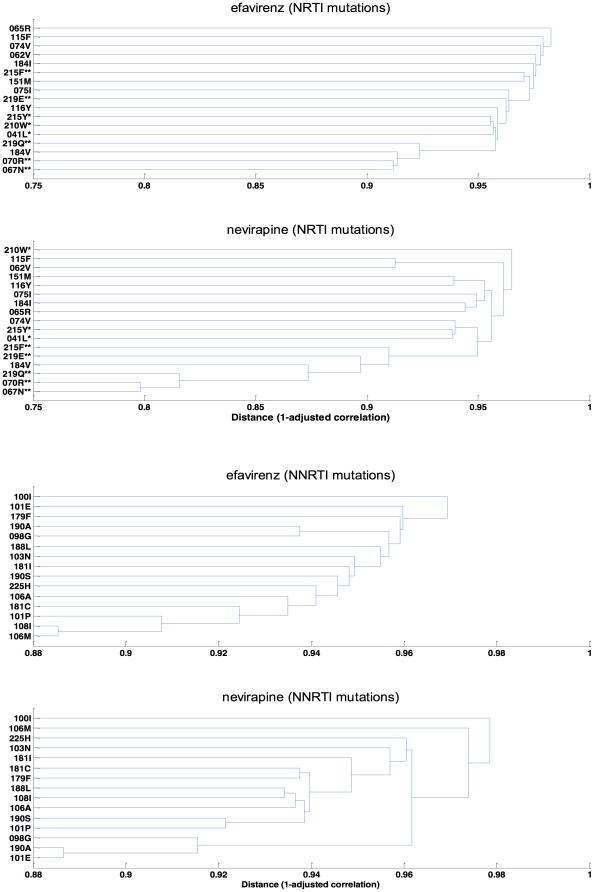
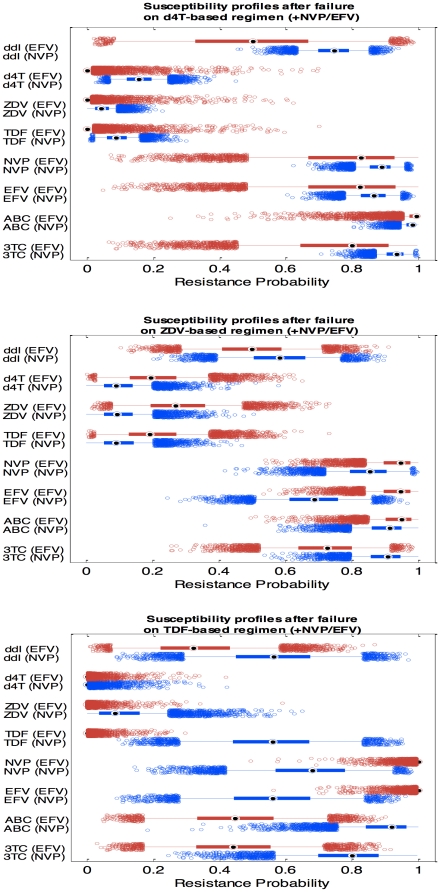
Methods and findings: In a treatment cohort of HIV-infected adults on NNRTI-based regimens, 119 experienced virologic failure (>500 copies/mL), with resistance mutations detected by consensus sequencing. Mutations were analyzed in relation to demographic, clinical, and laboratory variables at time of genotyping. The Geno2Pheno system was used to evaluate second-line drug options. Eighty-nine subjects were on nevirapine and 30 on efavirenz. The NRTI backbone consisted of lamivudine or emtricitabine plus either zidovudine (37), stavudine (65), or tenofovir (19). The K103N mutation was detected in 83% of patients on efavirenz vs. 28% on nevirapine, whereas Y181C was detected in 56% on nevirapine vs. 20% efavirenz. M184V was more common with nevirapine (87%) than efavirenz (63%). Nevirapine favored TAM-2 resistance pathways whereas efavirenz selected both TAM-2 and TAM-1 pathways. Emergence of TAM-2 mutations increased with the duration of virologic replication (OR 1.25-1.87 per month increment). In zidovudine-containing regimens, the overall risk of resistance across all drugs was lower with nevirapine than with efavirenz, whereas in tenofovir-containing regimen the opposite was true.
Conclusions: TAM-2 was the major NRTI resistance pathway for CRF01_AE, particularly with nevirapine; it appeared late after virological failure. In patients who failed, there appeared to be more second-line drug options when zidovudine was combined with nevirapine or tenofovir with efavirenz than with alternative combinations.
Conflict of interest statement
Figures
References
-
- World Health Organization. Antiretroviral therapy for HIV infection in adults and adolescents: recommendations for a public health approach. – 2010 rev. World Health Organization; 2010. - PubMed
-
- Deshpande A, Jeannot AC, Schrive MH, Wittkop L, Pinson P, et al. Analysis of RT sequences of subtype C HIV-type 1 isolates from indian patients at failure of a first-line treatment according to clinical and/or immunological WHO guidelines. AIDS Res Hum Retroviruses. 2010;26:343–350. - PubMed
-
- Hosseinipour MC, van Oosterhout JJ, Weigel R, Phiri S, Kamwendo D, et al. The public health approach to identify antiretroviral therapy failure: high-level nucleoside reverse transcriptase inhibitor resistance among Malawians failing first-line antiretroviral therapy. AIDS. 2009;23:1127–1134. - PMC - PubMed
Publication types
MeSH terms
Substances
Associated data
- Actions
- Actions
- Actions
- Actions
- Actions
- Actions
- Actions
- Actions
- Actions
- Actions
- Actions
- Actions
- Actions
- Actions
- Actions
- Actions
- Actions
- Actions
- Actions
- Actions
- Actions
- Actions
- Actions
- Actions
- Actions
- Actions
- Actions
- Actions
- Actions
- Actions
- Actions
- Actions
- Actions
- Actions
- Actions
- Actions
- Actions
- Actions
- Actions
- Actions
- Actions
- Actions
- Actions
- Actions
- Actions
- Actions
- Actions
- Actions
- Actions
- Actions
- Actions
- Actions
- Actions
- Actions
- Actions
- Actions
- Actions
- Actions
- Actions
- Actions
- Actions
- Actions
- Actions
- Actions
- Actions
- Actions
- Actions
- Actions
- Actions
- Actions
- Actions
- Actions
- Actions
- Actions
- Actions
- Actions
- Actions
- Actions
- Actions
- Actions
- Actions
- Actions
- Actions
- Actions
- Actions
- Actions
- Actions
- Actions
- Actions
- Actions
- Actions
- Actions
- Actions
- Actions
- Actions
- Actions
- Actions
- Actions
- Actions
- Actions
- Actions
- Actions
- Actions
- Actions
- Actions
- Actions
- Actions
- Actions
- Actions
- Actions
- Actions
- Actions
- Actions
- Actions
- Actions
- Actions
- Actions
- Actions
- Actions
- Actions
- Actions
Grants and funding
LinkOut - more resources
Full Text Sources
Medical
Molecular Biology Databases
