

Prevalence of antidepressant prescription or use in patients with acute coronary syndrome: a systematic review
- PMID: 22132126
- PMCID: PMC3222644
- DOI: 10.1371/journal.pone.0027671
Prevalence of antidepressant prescription or use in patients with acute coronary syndrome: a systematic review
Abstract
Background and objectives: Depression is common among acute coronary syndrome (ACS) patients and is associated with poor prognosis. Cardiac side effects of older antidepressants were well-known, but newer antidepressants are generally thought of as safe to use in patients with heart disease. The objective was to assess rates of antidepressant use or prescription to patients within a year of an ACS.
Methods: PubMed, PsycINFO, and CINAHL databases searched through May 29, 2009; manual searching of 33 journals from May 2009 to September 2010. Articles in any language were included if they reported point or period prevalence of antidepressant use or prescription in the 12 months prior or subsequent to an ACS for ≥100 patients. Two investigators independently selected studies for inclusion/exclusion and extracted methodological characteristics and outcomes from included studies (study setting, inclusion/exclusion criteria, sample size, prevalence of antidepressant prescription/use, method of assessing antidepressant prescription/use, time period of assessment).
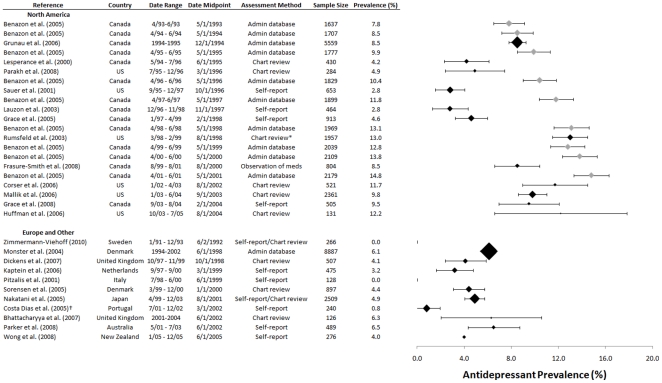
Results: A total of 24 articles were included. The majority were from North America and Europe, and most utilized chart review or self-report to assess antidepressant use or prescription. Although there was substantial heterogeneity in results, overall, rates of antidepressant use or prescription increased from less than 5% prior to 1995 to 10-15% after 2000. In general, studies from North America reported substantially higher rates than studies from Europe, approximately 5% higher among studies that used chart or self-report data.
Conclusions: Antidepressant use or prescription has increased considerably, and by 2005 approximately 10% to 15% of ACS patients were prescribed or using one of these drugs.
Conflict of interest statement
Figures

References
-
- Rudisch B, Nemeroff CB. Epidemiology of comorbid coronary artery disease and depression. Biol Psychiatry. 2003;54:227–240. - PubMed
-
- Rumsfeld JS, Ho PM. Depression and cardiovascular disease: a call for recognition. Circulation. 2005;111:250–253. - PubMed
-
- van Melle JP, de Jonge P, Spijkerman TA, Tijssen JG, Ormel J, et al. Prognostic association of depression following myocardial infarction with mortality and cardiovascular events: a meta-analysis. Psychosom Med. 2004;66:814–822. - PubMed
-
- Olfson M, Marcus SC. National patterns in antidepressant medication treatment. Arch Gen Psychiatry. 2009;66:848–856. - PubMed
Publication types
MeSH terms
Substances
Grants and funding
LinkOut - more resources
Full Text Sources
Medical
