. 2011;6(11):e27957.
doi: 10.1371/journal.pone.0027957. Epub 2011 Nov 21.

Switch of voltage-gated K+ channel expression in the plasma membrane of chondrogenic cells affects cytosolic Ca2+-oscillations and cartilage formation

Affiliations

Switch of voltage-gated K+ channel expression in the plasma membrane of chondrogenic cells affects cytosolic Ca2+-oscillations and cartilage formation

Zoltan Varga et al. PLoS One. 2011.

Abstract

Background: Understanding the key elements of signaling of chondroprogenitor cells at the earliest steps of differentiation may substantially improve our opportunities for the application of mesenchymal stem cells in cartilage tissue engineering, which is a promising approach of regenerative therapy of joint diseases. Ion channels, membrane potential and Ca(2+)-signaling are important regulators of cell proliferation and differentiation. Our aim was to identify such plasma membrane ion channels involved in signaling during chondrogenesis, which may serve as specific molecular targets for influencing chondrogenic differentiation and ultimately cartilage formation.

Methodology/principal findings: Using patch-clamp, RT-PCR and Western-blot experiments, we found that chondrogenic cells in primary micromass cell cultures obtained from embryonic chicken limb buds expressed voltage-gated Na(V)1.4, K(V)1.1, K(V)1.3 and K(V)4.1 channels, although K(V)1.3 was not detectable in the plasma membrane. Tetrodotoxin (TTX), the inhibitor of Na(V)1.4 channels, had no effect on cartilage formation. In contrast, presence of 20 mM of the K(+) channel blocker tetraethyl-ammonium (TEA) during the time-window of the final commitment of chondrogenic cells reduced K(V) currents (to 27±3% of control), cell proliferation (thymidine incorporation: to 39±4.4% of control), expression of cartilage-specific genes and consequently, cartilage formation (metachromasia: to 18.0±6.4% of control) and also depolarized the membrane potential (by 9.3±2.1 mV). High-frequency Ca(2+)-oscillations were also suppressed by 10 mM TEA (confocal microscopy: frequency to 8.5±2.6% of the control). Peak expression of TEA-sensitive K(V)1.1 in the plasma membrane overlapped with this period. Application of TEA to differentiated chondrocytes, mainly expressing the TEA-insensitive K(V)4.1 did not affect cartilage formation.

Conclusions/significance: These data demonstrate that the differentiation and proliferation of chondrogenic cells depend on rapid Ca(2+)-oscillations, which are modulated by K(V)-driven membrane potential changes. K(V)1.1 function seems especially critical during the final commitment period. We show the critical role of voltage-gated cation channels in the differentiation of non-excitable cells with potential therapeutic use.


Conflict of interest statement

Competing Interests: The authors have declared that no competing interests exist.

Figures

Figure 1
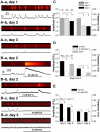
Figure 1. Spontaneous changes in [Ca2+]i and effects of different ion composition and TEA on spontaneous calcium events in cells of HDC.
(A) Representative line-scan images showing spontaneous changes in [Ca2+]i on various days of culturing. Images were recorded at 7 ms/line, 512 pixels/line. (B) Representative line-scan images recorded on days 2 and 3 demonstrating the effects of the ion milieu or TEA application on spontaneous Ca2+ events. Images were acquired at 14 ms/line and 512 pixels/line. Horizontal lines indicate the application of different solutions. For panels (A) and (B), traces below the images are spatially averaged time courses of Fluo-4 fluorescence normalized to baseline fluorescence (F/F0). Vertical calibrations are the same for all images and for all traces in panels (A) and (B). (C) Pooled data for the amplitude and frequency of spontaneous calcium transients measured in normal [Ca2+]e (1.8 mM) on different days of culturing. Asterisks (*) mark significant (p<0.05) differences between frequencies on different days of culturing as compared to day 1. Pooled data of the effects of (D) Ca2+-free milieu (days 2 and 3) and (E) 10 mM TEA (on day 2 and on day 3) on the amplitude and frequency of spontaneous calcium transients. Asterisks (*) indicate significant (p<0.05) differences between control and treated cells. Numbers above diagrams represent the number of cells measured during each measurement. Data represent mean ± standard error (SE) of the mean.
Figure 2
Figure 2. Electrophysiological properties of voltage-gated ion channels in chondrocytes.
(A) Whole-cell K+ currents recorded from a patch-clamped chondrocyte one day after cell isolation. Depolarizing pulses ranging from −70 to +50 mV were applied every 15 seconds from a holding potential of −100 mV. Currents show voltage-dependent gating. (B) Application of 20 mM extracellular TEA reversibly blocked the K+ current. The cell was held at a holding potential of −100 mV and was depolarized to +50 mV every 15 s. (C) Whole-cell Na+ currents recorded from a patch-clamped chondrocyte two days after cell isolation. The cell was held at a holding potential of −120 mV and was depolarized to 0 mV every 15 s. The Na+ current disappeared in an external solution containing 5 mM Na+, identical to the Na+ concentration in the pipette. (D) Tetrodotoxin reversibly blocked the Na+ current in a dose dependent manner.
Figure 3
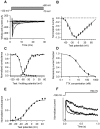
Figure 3. Detailed characterization of the voltage-gated Na+ and K+ currents.
(A) Na+ currents evoked by depolarizing pulses from −70 to +60 mV in 10 mV increments in a 2-day-old patch-clamped differentiating chondrocyte. (B) The current–voltage relationship of the Na+ current determined from the peak current at each voltage. (C) The functions describing the voltage dependence of steady-state activation (G–V curve) and inactivation mark a potential window for Na+ channel operation. The G–V curve was constructed from the current–voltage relationship. The voltage dependence of steady-state inactivation was obtained by holding the cells at the indicated holding potentials for 15 s then the peak current was recorded during a pulse to 0 mV. Data points were fitted with Boltzmann-functions yielding the half-activation (V1/2,a = −36.8 mV) and half-inactivation (V1/2,i = −72.4 mV) voltages. (D) Dose–response function of tetrodotoxin on Na+ channels of differentiating chondrocytes. Fitting the Hill equation to the data points yielded Kd = 12 nM and nH = 0.87. (E) Voltage dependence of the steady-state activation (G–V curve) of voltage-gated K+ channels in chondrocytes. The G–V relationship was constructed from the current–voltage relationship at each test potential using Erev = −85 mV; points were fitted with a Boltzmann-function. The curve represents a mixture of KV1.1 and KV4.1 channels, and the obtained V1/2 = −15.5 mV lies between the V1/2 of those channels. (F) Normalized current traces recorded from three different cells representing the highly variable inactivation rate of the K+ current. Cells were depolarized to +50 mV for 1.5 s, the first 1 s is shown for clarity.
Figure 4
Figure 4. Expression profile of voltage-gated ion channels in cells of HDC on various days of culturing.
mRNA (A) and protein (B) expression from total cell lysate of NaV1.4, KV1.1, KV1.3 and KV4.1in cells of HDC on various days of culturing. For RT-PCR reactions, GAPDH was used as a control. A degenerated NaV primer was used as a positive control. (C) Membrane fraction samples were used to demonstrate the presence of channel proteins in the plasma membrane.
Figure 5
Figure 5. Changing kinetics and TEA-sensitivity of the K+ current during differentiation can be reproduced by simulated current traces.
Whole-cell K+ currents recorded from a chondrogenic cell on the day of isolation (A) and on day 1 of culturing (B) in the absence and presence of 20 mM TEA. Currents were elicited by 1.5 s-long depolarizing pulses to +50 mV from a holding potential of −80 mV. For clarity the first 600 ms are shown. (C and D) Whole-cell K+ currents were modeled as the sum of currents through three different K+ channels: KV1.1, KV4.1 and a voltage-independent, possibly 2-pore channel. Simulations were based on the TEA sensitivity and inactivation kinetics. Calculated current traces with red lines are overlaid on recorded traces in the absence and presence of 20 mM TEA. The free parameters were the relative contributions of each channel type to the total whole-cell K+ current. Although more current components may also contribute, traces could be adequately reproduced by these three components. Traces on panels C and D are identical to those on panels A and B, respectively. The non-inactivating voltage-independent current component determined from the simulation was subtracted from the traces on panels A and B.
Figure 6
Figure 6. Effects of TTX (10 µM) and TEA (20 mM) on cartilage matrix production, viability and proliferation of HDC.
(A) Metachromatic cartilage areas in 6-day-old high-density colonies were visualized with DMMB dissolved in 3% acetic acid. Optical density (OD625) was determined in samples containing toluidine blue extracted with 8% HCl dissolved in absolute ethanol. Scale bar, 500 µM. (B) Effects of TTX and TEA treatments on cellular metabolic activity and cellular proliferation in HDC. Assays were carried out during the administration of TTX and TEA. (C–D) Effects of TTX and TEA treatment on the mRNA expression of Sox9, type II collagen and aggrecan on days 3 and 6, and protein expression and phosphorylation level of Sox9 in HDC on day 3 of culturing. For RT-PCR reactions, GAPDH was used as a control.
Figure 7
Figure 7. Membrane potential recordings from whole-cell patch-clamped chondrogenic cells.
(A) The membrane potential distribution of the differentiating chondrogenic cells shows a bimodal distribution depending on the presence or absence of a voltage-independent K+ channel (VIKC). 5th, 10th, 25th, 50th, 75th, 90th and 95th percentiles are shown. (B) Application of 20 mM extracellular TEA caused a reversible depolarization of the cells, which was more significant for cells with more positive membrane potentials (a) than those with membrane potentials close to the K+ reversal potential (b). (C) Reversible depolarization of the membrane potential by the extracellular application of 150 K+. (D) Spontaneous hyperpolarization of the membrane potential of a patch-clamped chondrocyte close to the K+ reversal potential due to the activation of the voltage-independent K+ channel. (E) Spontaneous activation of the voltage-independent K+ channel during voltage-clamp recording. Whole-cell current traces were recorded during voltage-ramps running from −120 mV to +50 mV in 150 ms. Selected traces indicate the activity of the NaV and KV channels at the beginning of the recording, of which KV channels were blocked by 20 mM TEA. During recording a large, voltage-independent and highly K+-selective conductance was activated as indicated by its reversal potential.

References

    1. Centeno CJ, Busse D, Kisiday J, Keohan C, Freeman M, et al. Increased knee cartilage volume in degenerative joint disease using percutaneously implanted, autologous mesenchymal stem cells. Pain Physician. 2008;11:343–353. - PubMed
    1. Galle J, Bader A, Hepp P, Grill W, Fuchs B, et al. Mesenchymal stem cells in cartilage repair: state of the art and methods to monitor cell growth, differentiation and cartilage regeneration. Curr Med Chem. 2010;17:2274–2291. - PubMed
    1. Freyria AM, Mallein-Gerin F. Chondrocytes or adult stem cells for cartilage repair: The indisputable role of growth factors. Injury. 2011 In press: doi:10.1016/j.injury.2011.05.035. - PubMed
    1. Juretic N, Urzua U, Munroe DJ, Jaimovich E, Riveros N. Differential gene expression in skeletal muscle cells after membrane depolarization. J Cell Physiol. 2007;210:819–830. - PubMed
    1. Helmlinger G, Berk BC, Nerem RM. Pulsatile and steady flow-induced calcium oscillations in single cultured endothelial cells. J Vasc Res. 1996;33:360–369. - PubMed

Publication types

MeSH terms