

Transcriptional downregulation of rice rpL32 gene under abiotic stress is associated with removal of transcription factors within the promoter region
- PMID: 22132208
- PMCID: PMC3223225
- DOI: 10.1371/journal.pone.0028058
Transcriptional downregulation of rice rpL32 gene under abiotic stress is associated with removal of transcription factors within the promoter region
Abstract
Background: The regulation of ribosomal proteins in plants under stress conditions has not been well studied. Although a few reports have shown stress-specific post-transcriptional and translational mechanisms involved in downregulation of ribosomal proteins yet stress-responsive transcriptional regulation of ribosomal proteins is largely unknown in plants.
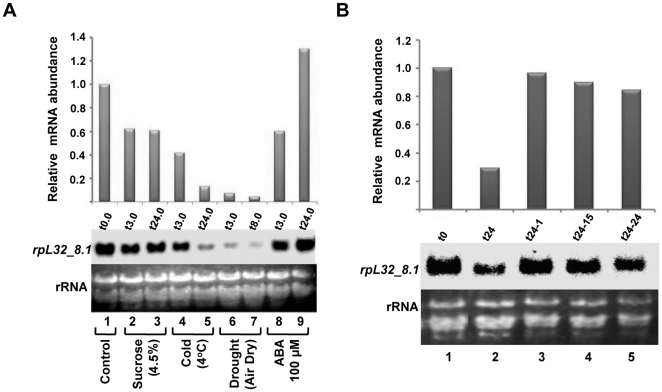
Methodology/principal findings: In the present work, transcriptional regulation of genes encoding rice 60S ribosomal protein L32 (rpL32) in response to salt stress has been studied. Northern and RT-PCR analyses showed a significant downregulation of rpL32 transcripts under abiotic stress conditions in rice. Of the four rpL32 genes in rice genome, the gene on chromosome 8 (rpL32_8.1) showed a higher degree of stress-responsive downregulation in salt sensitive rice variety than in tolerant one and its expression reverted to its original level upon withdrawal of stress. The nuclear run-on and promoter:reporter assays revealed that the downregulation of this gene is transcriptional and originates within the promoter region. Using in vivo footprinting and electrophoretic mobility shift assay (EMSA), cis-elements in the promoter of rpL32_8.1 showing reduced binding to proteins in shoots of salt stressed rice seedlings were identified.
Conclusions: The present work is one of the few reports on study of stress downregulated genes. The data revealed that rpL32 gene is transcriptionally downregulated under abiotic stress in rice and that this transcriptional downregulation is associated with the removal of transcription factors from specific promoter elements.
Conflict of interest statement
Figures


Similar articles
-
Stress-mediated alterations in chromatin architecture correlate with down-regulation of a gene encoding 60S rpL32 in rice.Plant Cell Physiol. 2013 Apr;54(4):528-40. doi: 10.1093/pcp/pct012. Epub 2013 Jan 28. Plant Cell Physiol. 2013. PMID: 23359423
-
An ABRE-binding factor, OSBZ8, is highly expressed in salt tolerant cultivars than in salt sensitive cultivars of indica rice.BMC Plant Biol. 2006 Aug 30;6:18. doi: 10.1186/1471-2229-6-18. BMC Plant Biol. 2006. PMID: 16939657 Free PMC article.
-
Five novel transcription factors as potential regulators of OsNHX1 gene expression in a salt tolerant rice genotype.Plant Mol Biol. 2017 Jan;93(1-2):61-77. doi: 10.1007/s11103-016-0547-7. Epub 2016 Oct 20. Plant Mol Biol. 2017. PMID: 27766460
-
WRKY transcription factors: a promising way to deal with arsenic stress in rice.Mol Biol Rep. 2022 Nov;49(11):10895-10904. doi: 10.1007/s11033-022-07772-9. Epub 2022 Aug 8. Mol Biol Rep. 2022. PMID: 35941412 Review.
-
Implication of ribosomal protein in abiotic and biotic stress.Planta. 2025 Mar 11;261(4):85. doi: 10.1007/s00425-025-04665-6. Planta. 2025. PMID: 40067484 Review.
Cited by
-
The plasticity of the grapevine berry transcriptome.Genome Biol. 2013 Jun 7;14(6):r54. doi: 10.1186/gb-2013-14-6-r54. Genome Biol. 2013. PMID: 23759170 Free PMC article.
-
Transcriptome Profiling of the Salt Stress Response in the Leaves and Roots of Halophytic Eutrema salsugineum.Front Genet. 2021 Nov 18;12:770742. doi: 10.3389/fgene.2021.770742. eCollection 2021. Front Genet. 2021. PMID: 34868259 Free PMC article.
-
Analysis of global gene expression profile of rice in response to methylglyoxal indicates its possible role as a stress signal molecule.Front Plant Sci. 2015 Sep 3;6:682. doi: 10.3389/fpls.2015.00682. eCollection 2015. Front Plant Sci. 2015. PMID: 26388885 Free PMC article.
-
Decoding the Chloroplast Genome of Tetrastigma (Vitaceae): Variations and Phylogenetic Selection Insights.Int J Mol Sci. 2024 Jul 29;25(15):8290. doi: 10.3390/ijms25158290. Int J Mol Sci. 2024. PMID: 39125860 Free PMC article.
-
Variety-Specific Transcriptional and Alternative Splicing Regulations Modulate Salt Tolerance in Rice from Early Stage of Stress.Rice (N Y). 2022 Nov 3;15(1):56. doi: 10.1186/s12284-022-00599-9. Rice (N Y). 2022. PMID: 36326968 Free PMC article.
References
-
- Richards RA. Defining selection criteria to improve yield under drought. Plant Growth Regul. 1996;20:157–166.
-
- Xiong L, Zhu JK. Molecular and genetic aspects of plant responses to osmotic stress. Plant Cell Environ. 2002;25:131–139. - PubMed
-
- Xiong L, Zhu J-K. Abiotic stress signal transduction in plants: Molecular and genetic perspectives. Physiol Plant. 2001;112:152–166. - PubMed
Publication types
MeSH terms
Substances
LinkOut - more resources
Full Text Sources
Molecular Biology Databases
