

Insulin receptor-mediated signaling via phospholipase C-γ regulates growth and differentiation in Drosophila
- PMID: 22132213
- PMCID: PMC3221684
- DOI: 10.1371/journal.pone.0028067
Insulin receptor-mediated signaling via phospholipase C-γ regulates growth and differentiation in Drosophila
Abstract
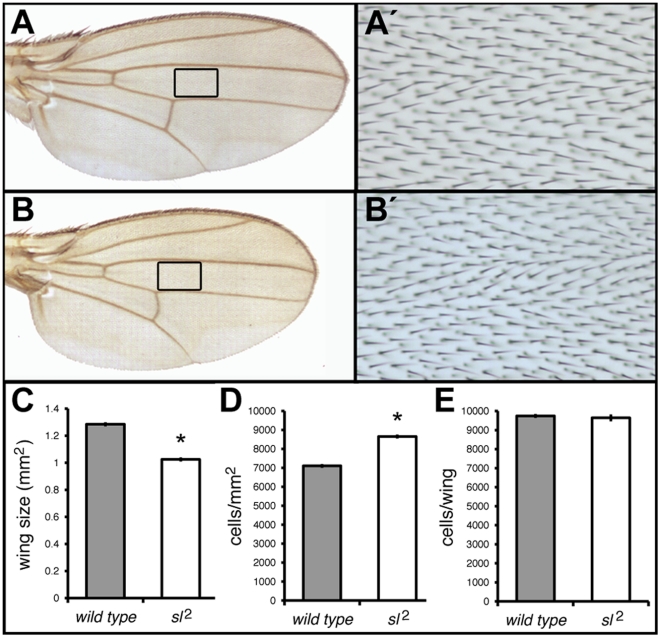
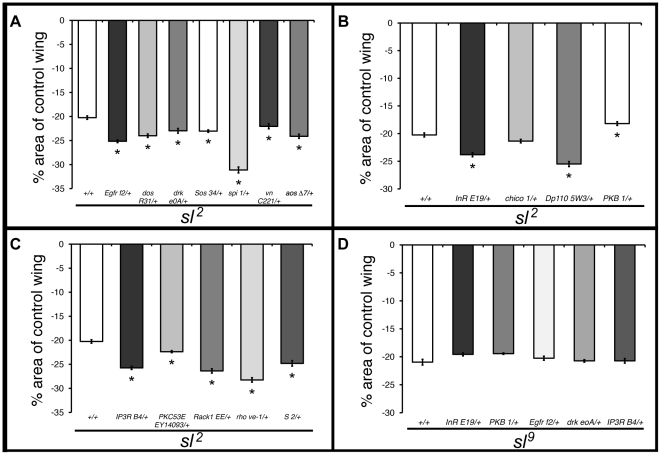
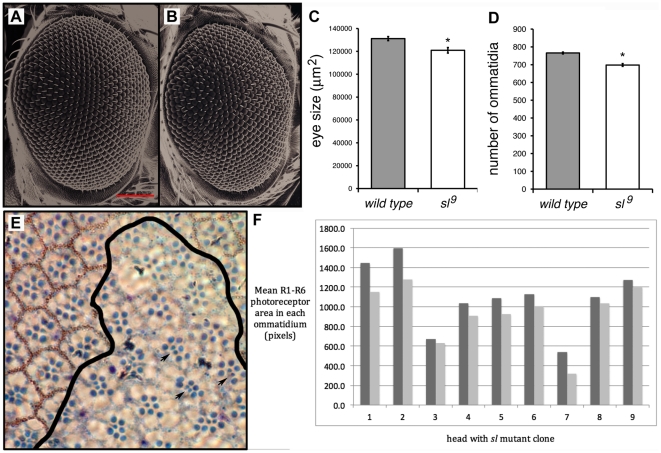
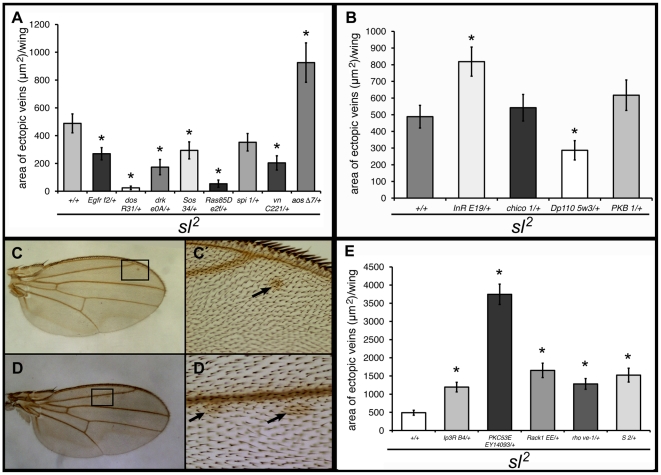
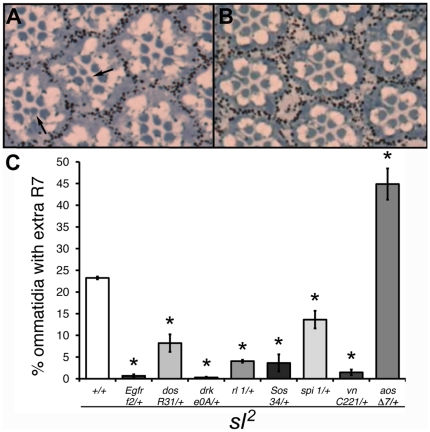
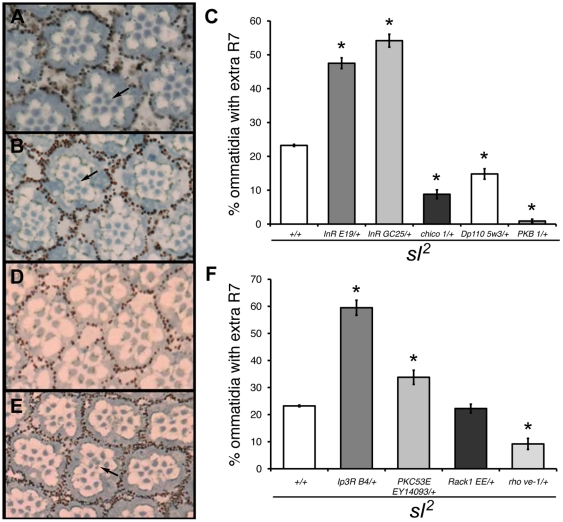
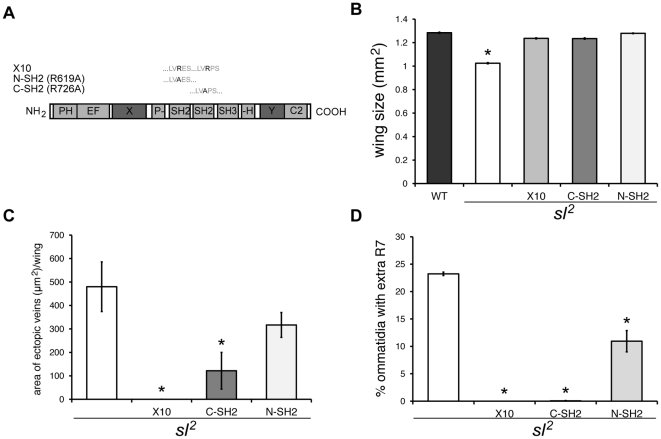
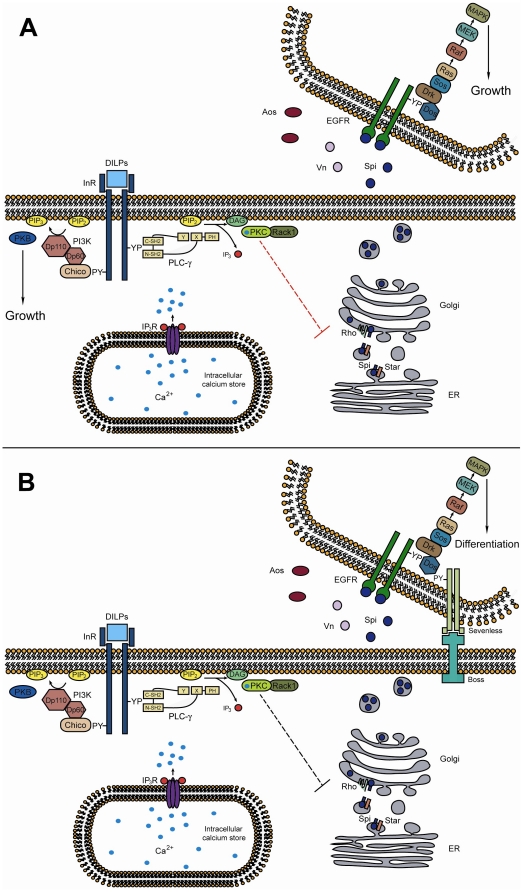
Coordination between growth and patterning/differentiation is critical if appropriate final organ structure and size is to be achieved. Understanding how these two processes are regulated is therefore a fundamental and as yet incompletely answered question. Here we show through genetic analysis that the phospholipase C-γ (PLC-γ) encoded by small wing (sl) acts as such a link between growth and patterning/differentiation by modulating some MAPK outputs once activated by the insulin pathway; particularly, sl promotes growth and suppresses ectopic differentiation in the developing eye and wing, allowing cells to attain a normal size and differentiate properly. sl mutants have previously been shown to have a combination of both growth and patterning/differentiation phenotypes: small wings, ectopic wing veins, and extra R7 photoreceptor cells. We show here that PLC-γ activated by the insulin pathway participates broadly and positively during cell growth modulating EGF pathway activity, whereas in cell differentiation PLC-γ activated by the insulin receptor negatively regulates the EGF pathway. These roles require different SH2 domains of PLC-γ, and act via classic PLC-γ signaling and EGF ligand processing. By means of PLC-γ, the insulin receptor therefore modulates differentiation as well as growth. Overall, our results provide evidence that PLC-γ acts during development at a time when growth ends and differentiation begins, and is important for proper coordination of these two processes.
Conflict of interest statement
Figures
Similar articles
-
small wing encodes a phospholipase C-(gamma) that acts as a negative regulator of R7 development in Drosophila.Development. 1998 Dec;125(24):5033-42. doi: 10.1242/dev.125.24.5033. Development. 1998. PMID: 9811587
-
Distinct phospholipase C-gamma-dependent signaling pathways in the Drosophila eye and wing are revealed by a new small wing allele.Genetics. 2003 Jun;164(2):553-63. doi: 10.1093/genetics/164.2.553. Genetics. 2003. PMID: 12807776 Free PMC article.
-
Temporal control of differentiation by the insulin receptor/tor pathway in Drosophila.Cell. 2004 Oct 1;119(1):87-96. doi: 10.1016/j.cell.2004.08.028. Cell. 2004. PMID: 15454083
-
Pattern formation in the Drosophila wing: The development of the veins.Bioessays. 2003 May;25(5):443-51. doi: 10.1002/bies.10258. Bioessays. 2003. PMID: 12717815 Review.
-
Organ Size Control: Lessons from Drosophila.Dev Cell. 2015 Aug 10;34(3):255-65. doi: 10.1016/j.devcel.2015.07.012. Dev Cell. 2015. PMID: 26267393 Free PMC article. Review.
Cited by
-
Using Drosophila Models and Tools to Understand the Mechanisms of Novel Human Cancer Driver Gene Function.Adv Exp Med Biol. 2019;1167:15-35. doi: 10.1007/978-3-030-23629-8_2. Adv Exp Med Biol. 2019. PMID: 31520347 Review.
-
Inhibition of EGF signaling protects the diabetic retina from insulin-induced vascular leakage.Am J Pathol. 2013 Sep;183(3):987-95. doi: 10.1016/j.ajpath.2013.05.017. Epub 2013 Jul 3. Am J Pathol. 2013. PMID: 23831329 Free PMC article.
-
Drosophila melanogaster as a Model for Diabetes Type 2 Progression.Biomed Res Int. 2018 Apr 24;2018:1417528. doi: 10.1155/2018/1417528. eCollection 2018. Biomed Res Int. 2018. PMID: 29854726 Free PMC article. Review.
-
Inositol phosphate kinase 2 is required for imaginal disc development in Drosophila.Proc Natl Acad Sci U S A. 2015 Dec 22;112(51):15660-5. doi: 10.1073/pnas.1514684112. Epub 2015 Dec 8. Proc Natl Acad Sci U S A. 2015. PMID: 26647185 Free PMC article.
-
Decoding Calcium Signaling Dynamics during Drosophila Wing Disc Development.Biophys J. 2019 Feb 19;116(4):725-740. doi: 10.1016/j.bpj.2019.01.007. Epub 2019 Jan 11. Biophys J. 2019. PMID: 30704858 Free PMC article.
References
-
- Patterson RL, van Rossum DB, Nikolaidis N, Gill DL, Snyder SH. Phospholipase C-γ: diverse roles in receptor-mediated calcium signaling. Trends Biochem Sci. 2005;30:688–697. - PubMed
-
- Choi JH, Ryu SH, Suh PG. On/off-regulation of phospholipase C-γ1-mediated signal transduction. Adv Enzyme Regul. 2007;47:104–116. - PubMed
-
- Suh PG, Park JI, Manzoli L, Cocco L, Peak JC, et al. Multiple roles of phosphoinositide-specific phospholipase C isozymes. BMB Rep. 2008;41:415–434. - PubMed
-
- Thackeray JR, Gaines PC, Ebert P, Carlson JR. small wing encodes a phospholipase C-γ that acts as a negative regulator of R7 development in Drosophila. Development. 1998;125:5033–5042. - PubMed
Publication types
MeSH terms
Substances
LinkOut - more resources
Full Text Sources
Molecular Biology Databases
