

Aberrant regulation of HDAC2 mediates proliferation of hepatocellular carcinoma cells by deregulating expression of G1/S cell cycle proteins
- PMID: 22132221
- PMCID: PMC3223227
- DOI: 10.1371/journal.pone.0028103
Aberrant regulation of HDAC2 mediates proliferation of hepatocellular carcinoma cells by deregulating expression of G1/S cell cycle proteins
Abstract
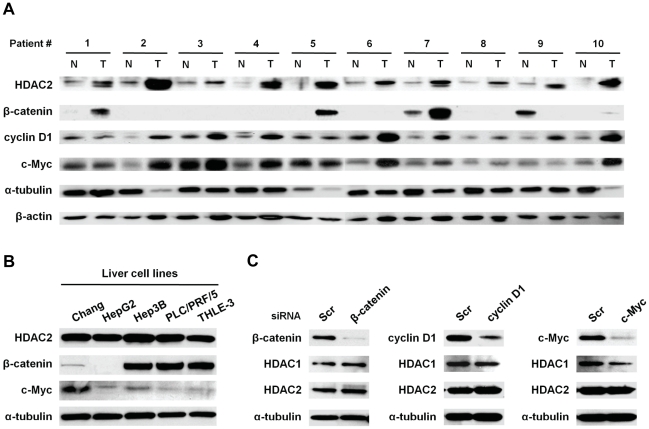
Histone deacetylase 2 (HDAC2) is crucial for embryonic development, affects cytokine signaling relevant for immune responses and is often significantly overexpressed in solid tumors; but little is known about its role in human hepatocellular carcinoma (HCC). In this study, we showed that targeted-disruption of HDAC2 resulted in reduction of both tumor cell growth and de novo DNA synthesis in Hep3B cells. We then demonstrated that HDAC2 regulated cell cycle and that disruption of HDAC2 caused G1/S arrest in cell cycle. In G1/S transition, targeted-disruption of HDAC2 selectively induced the expression of p16(INK4A) and p21(WAF1/Cip1), and simultaneously suppressed the expression of cyclin D1, CDK4 and CDK2. Consequently, HDAC2 inhibition led to the down-regulation of E2F/DP1 target genes through a reduction in phosphorylation status of pRb protein. In addition, sustained suppression of HDAC2 attenuated in vitro colony formation and in vivo tumor growth in a mouse xenograft model. Further, we found that HDAC2 suppresses p21(WAF1/Cip1) transcriptional activity via Sp1-binding site enriched proximal region of p21(WAF1/Cip1) promoter. In conclusion, we suggest that the aberrant regulation of HDAC2 may play a pivotal role in the development of HCC through its regulation of cell cycle components at the transcription level providing HDAC2 as a relevant target in liver cancer therapy.
Conflict of interest statement
Figures


Similar articles
-
HDAC1 inactivation induces mitotic defect and caspase-independent autophagic cell death in liver cancer.PLoS One. 2012;7(4):e34265. doi: 10.1371/journal.pone.0034265. Epub 2012 Apr 4. PLoS One. 2012. PMID: 22496786 Free PMC article.
-
HDAC2 overexpression confers oncogenic potential to human lung cancer cells by deregulating expression of apoptosis and cell cycle proteins.J Cell Biochem. 2012 Jun;113(6):2167-77. doi: 10.1002/jcb.24090. J Cell Biochem. 2012. PMID: 22492270
-
Pharmacological or transcriptional inhibition of both HDAC1 and 2 leads to cell cycle blockage and apoptosis via p21Waf1/Cip1 and p19INK4d upregulation in hepatocellular carcinoma.Cell Prolif. 2018 Jun;51(3):e12447. doi: 10.1111/cpr.12447. Epub 2018 Feb 27. Cell Prolif. 2018. PMID: 29484736 Free PMC article.
-
[Molecular mechanisms controlling the cell cycle: fundamental aspects and implications for oncology].Cancer Radiother. 2001 Apr;5(2):109-29. doi: 10.1016/s1278-3218(01)00087-7. Cancer Radiother. 2001. PMID: 11355576 Review. French.
-
Molecular mechanism underlying the functional loss of cyclindependent kinase inhibitors p16 and p27 in hepatocellular carcinoma.World J Gastroenterol. 2008 Mar 21;14(11):1734-40. doi: 10.3748/wjg.14.1734. World J Gastroenterol. 2008. PMID: 18350604 Free PMC article. Review.
Cited by
-
HDAC1 inactivation induces mitotic defect and caspase-independent autophagic cell death in liver cancer.PLoS One. 2012;7(4):e34265. doi: 10.1371/journal.pone.0034265. Epub 2012 Apr 4. PLoS One. 2012. PMID: 22496786 Free PMC article.
-
Histone Deacetylases and Their Regulatory MicroRNAs in Hepatocarcinogenesis.J Korean Med Sci. 2015 Oct;30(10):1375-80. doi: 10.3346/jkms.2015.30.10.1375. Epub 2015 Sep 12. J Korean Med Sci. 2015. PMID: 26425032 Free PMC article. Review.
-
Discovery of novel and highly potent dual-targeting PKMYT1/HDAC2 inhibitors for hepatocellular carcinoma through structure-based virtual screening and biological evaluation.Front Pharmacol. 2024 Nov 15;15:1491497. doi: 10.3389/fphar.2024.1491497. eCollection 2024. Front Pharmacol. 2024. PMID: 39619613 Free PMC article.
-
Chemopreventive effects of an HDAC2-selective inhibitor on rat colon carcinogenesis and APCmin/+ mouse intestinal tumorigenesis.J Pharmacol Exp Ther. 2014 Jan;348(1):59-68. doi: 10.1124/jpet.113.208645. Epub 2013 Nov 11. J Pharmacol Exp Ther. 2014. PMID: 24218540 Free PMC article.
-
Droxinostat, a Histone Deacetylase Inhibitor, Induces Apoptosis in Hepatocellular Carcinoma Cell Lines via Activation of the Mitochondrial Pathway and Downregulation of FLIP.Transl Oncol. 2016 Feb;9(1):70-78. doi: 10.1016/j.tranon.2016.01.004. Transl Oncol. 2016. PMID: 26947884 Free PMC article.
References
-
- Glozak MA, Seto E. Histone deacetylases and cancer. Oncogene. 2007;26:5420–5432. - PubMed
-
- Gallinari P, Di Marco S, Jones P, Pallaoro M, Steinkuhler C. HDACs, histone deacetylation and gene transcription: from molecular biology to cancer therapeutics. Cell Res. 2007;17:195–211. - PubMed
-
- Witt O, Deubzer HE, Milde T, Oehme I. HDAC family: What are the cancer relevant targets? Cancer Lett. 2009;277:8–21. - PubMed
-
- Marks P, Rifkind RA, Richon VM, Breslow R, Miller T, et al. Histone deacetylases and cancer: causes and therapies. Nat Rev Cancer. 2001;1:194–202. - PubMed
-
- Yang XJ, Seto E. HATs and HDACs: from structure, function and regulation to novel strategies for therapy and prevention. Oncogene. 2007;26:5310–5318. - PubMed
Publication types
MeSH terms
Substances
LinkOut - more resources
Full Text Sources
Molecular Biology Databases
Research Materials
