Randomized Controlled Trial
. 2012 Feb;153(2):319-330.
doi: 10.1016/j.pain.2011.10.025. Epub 2011 Nov 30.

A randomized controlled evaluation of an online chronic pain self management program

Affiliations
Randomized Controlled Trial

A randomized controlled evaluation of an online chronic pain self management program

Linda S Ruehlman et al. Pain. 2012 Feb.

Abstract

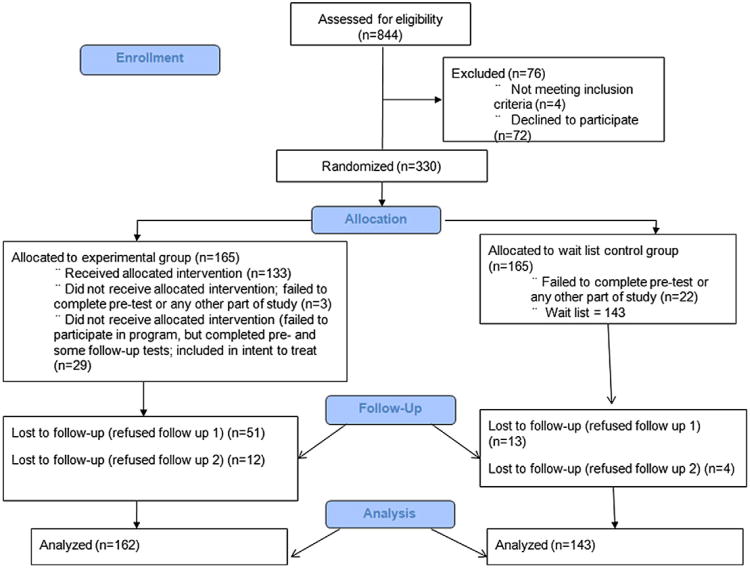
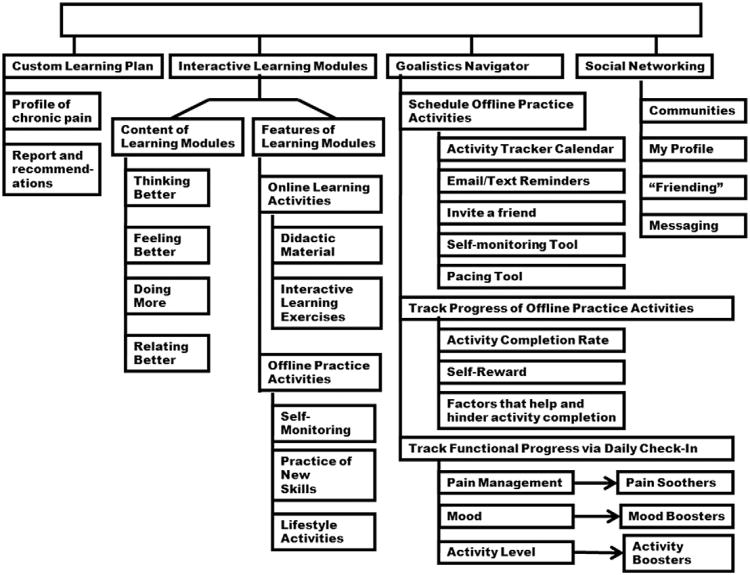
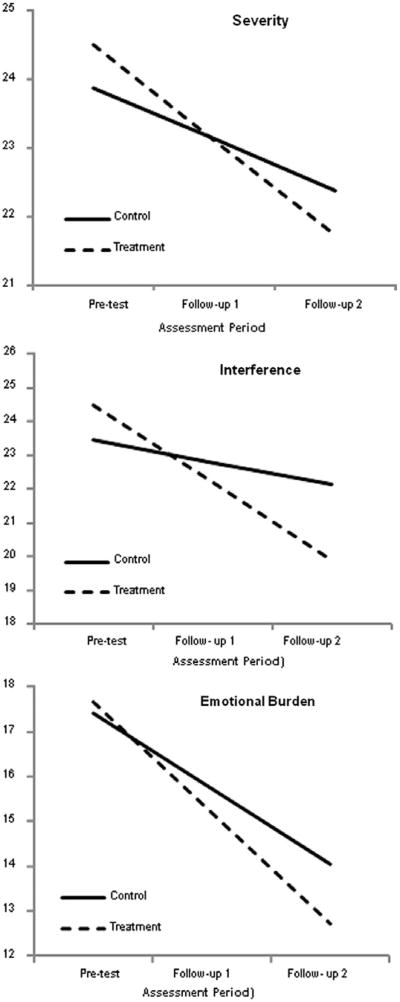
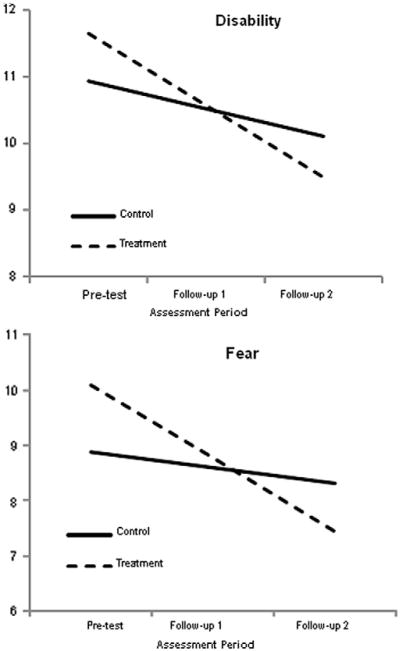
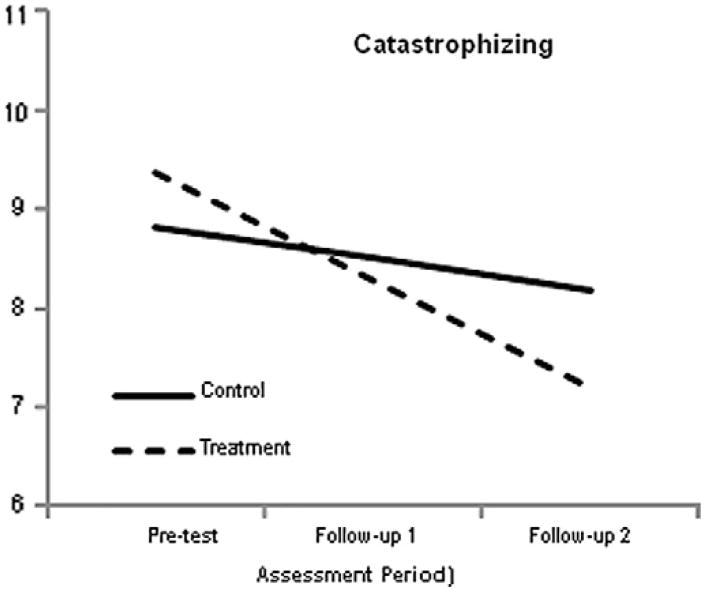
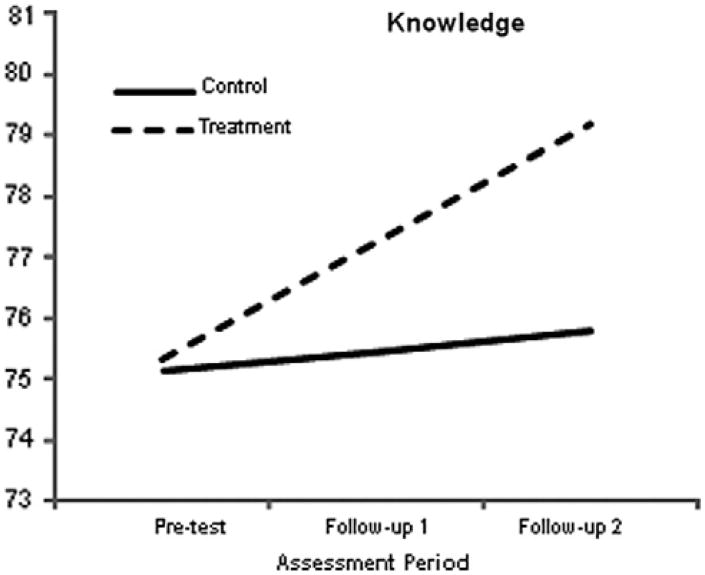
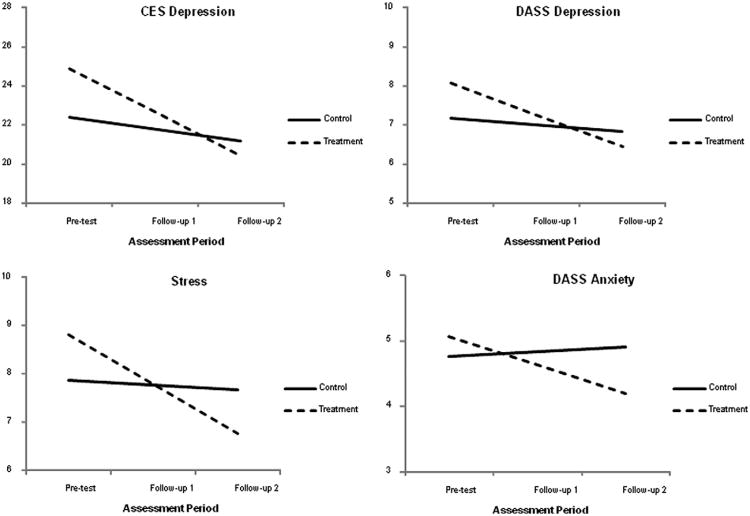
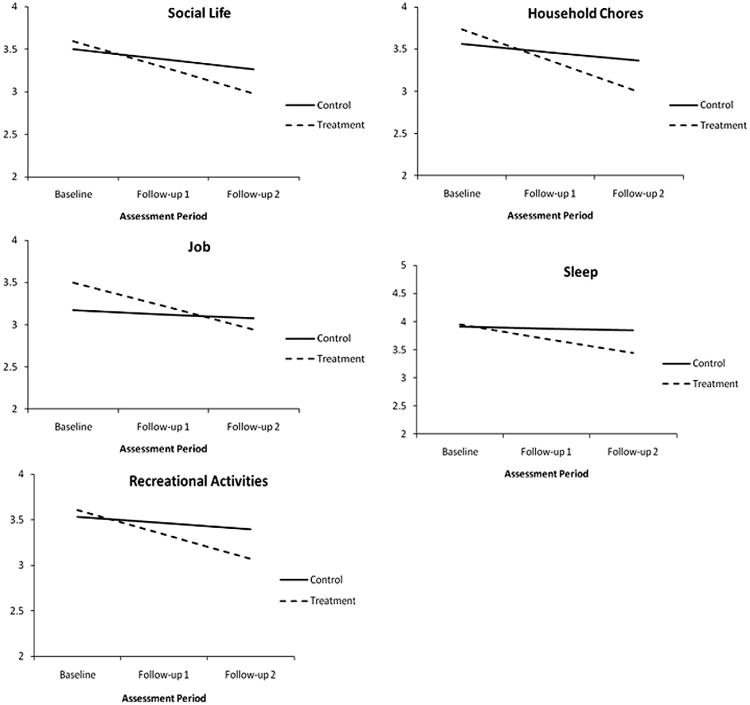
Internet-based educational and therapeutic programs (e-health applications) are becoming increasingly popular for a variety of psychological and physical disorders. We tested the efficacy of an online Chronic Pain Management Program, a comprehensive, fully self-directed and self-paced system that integrates social networking features and self-management tools into an interactive learning environment. Of 305 adult participants (196 women, 109 men), a total of 162 individuals with chronic pain were randomly assigned unsupervised access to the program for approximately 6 weeks; 143 were assigned to the wait-listed control group with treatment as usual. A comprehensive assessment was administered before the study and approximately 7 and 14 weeks thereafter. All recruitment, data collection, and participant involvement took place online. Participation was fully self-paced, permitting the evaluation of program effectiveness under real-world conditions. Intent-to-treat analysis that used linear growth models was used as the primary analytic tool. Results indicated that program utilization was associated with significant decreases in pain severity, pain-related interference and emotional burden, perceived disability, catastrophizing, and pain-induced fear. Further, program use led to significant declines in depression, anxiety, and stress. Finally, as compared to the wait-listed control group, the experimental group displayed a significant increase in knowledge about the principles of chronic pain and its management. Study limitations are considered, including the recognition that not all persons with chronic pain are necessarily good candidates for self-initiated, self-paced, interactive learning.


Conflict of interest statement

Sponsorships or competing interests that may be relevant to content are disclosed at the end of this article.

Conflict of interest statement: The content is solely the responsibility of the authors and does not necessarily represent the official views of the National Institute of Neurological Disorders and Stroke or those of the National Institutes of Health. The support for this research was administered via the Small Business Innovation Research (SBIR) mechanism of NIH, which expressly encourages the development of a commercial product. The pain program herein described is that product, fully owned by the first 2 authors. The third author declares neither ownership nor conflict of interest

Figures

Fig. 1
Fig. 1
Participant flow diagram.
Fig. 2
Fig. 2
Structure of the Chronic Pain Management Program.
Fig. 3
Fig. 3
Simple slopes for the extent of pain problems outcome measures. The graphs suggest that the amount of time between pretest and follow-up 1 was identical to the time between follow-up 1 and follow-up 2, which it was not. The growth curve analyses modeled change as a function of the square root of time since pretest. This transformation effectively equated the amount of elapsed time between the 2 pairs of assessments. Although the graphs suggest that change was constant, the greatest changes occurred between pretest and follow-up 1. However, this transformation does not affect the end-point differences (ie, the vertical separation of the simple slopes at follow-up 2).
Fig. 4
Fig. 4
Simple slopes for the pain attitudes and beliefs outcomes. The graphs suggest that the amount of time between pretest and follow-up 1 was identical to the time between follow-up 1 and follow-up 2, which it was not. The growth curve analyses modeled change as a function of the square root of time since pretest. This transformation effectively equated the amount of elapsed time between the 2 pairs of assessments. Although the graphs suggest that change was constant, the greatest changes occurred between pretest and follow-up 1. However, this transformation does not affect the end-point differences (ie, the vertical separation of the simple slopes at follow-up 2).
Fig. 5
Fig. 5
Simple slopes for the catastrophizing outcome. The graph suggests that the amount of time between pretest and follow-up 1 was identical to the time between follow-up 1 and follow-up 2, which it was not. The growth curve analyses modeled change as a function of the square root of time since pretest. This transformation effectively equated the amount of elapsed time between the 2 pairs of assessments. Although the graph suggests that change was constant, the greatest changes occurred between pretest and follow-up 1. However, this transformation does not affect the end-point differences (ie, the vertical separation of the simple slopes at follow-up 2).
Fig. 6
Fig. 6
Simple slopes for the pain knowledge outcome. The graph suggests that the amount of time between pretest and follow-up 1 was identical to the time between follow-up 1 and follow-up 2, which it was not. The growth curve analyses modeled change as a function of the square root of time since pretest. This transformation effectively equated the amount of elapsed time between the 2 pairs of assessments. Although the graph suggests that change was constant, the greatest changes occurred between pretest and follow-up 1. However, this transformation does not affect the end-point differences (ie, the vertical separation of the simple slopes at follow-up 2).
Fig. 7
Fig. 7
Simple slopes for the CES-D and DASS scales. The graphs suggest that the amount of time between pretest and follow-up 1 was identical to the time between follow-up 1 and follow-up 2, which it was not. The growth curve analyses modeled change as a function of the square root of time since pretest. This transformation effectively equated the amount of elapsed time between the 2 pairs of assessments. Although the graphs suggest that change was constant, the greatest changes occurred between pretest and follow-up 1. However, this transformation does not affect the end-point differences (ie, the vertical separation of the simple slopes at follow-up 2).
Fig. 8
Fig. 8
Simple slopes for areas of interference. The graphs suggest that the amount of time between pretest and follow-up 1 was identical to the time between follow-up 1 and follow-up 2, which it was not. The growth curve analyses modeled change as a function of the square root of time since pretest. This transformation effectively equated the amount of elapsed time between the 2 pairs of assessments. Although the graphs suggest that change was constant, the greatest changes occurred between pretest and follow-up 1. However, this transformation does not affect the end-point differences (ie, the vertical separation of the simple slopes at follow-up 2).

References

    1. Appel PR, Bleiberg J, Noiseux J. Self-regulation training for chronic pain: can it be done effectively by telemedicine? Telemed J E Health. 2002;8:361–8. - PubMed
    1. Begg C, Cho M, Eastwood S, Horton R, Moher D, Olkin I, Pitkin R, Rennie D, Schulz KF, Simel D, Stroup DF. Improving the quality of reporting of randomized control trials. The CONSORT statement. JAMA. 1996;276:637–9. - PubMed
    1. Bender JL, Radhakrishnan A, Diorio C, Englesakis M, Jadad AR. Can pain be managed through the Internet? A systematic review of randomized controlled trials. Pain. 2011;152:1740–50. - PubMed
    1. Black AD, Car J, Pagliari C, Anandan C, Cresswell K, Bokun T, McKinstry B, Procter R, Majeed A, Sheikh A. The impact of eHealth on the quality and safety of health care: a systematic overview. PLoS Med. 2011;8:e1000387. - PMC - PubMed
    1. Carlbring P, Westling BE, Ljungstrand P, Ekselius L, Andersson G. Treatment of panic disorder via the Internet: a randomized trial of a self-help program. Behav Ther. 2001;32:751–64.

Publication types