. 2011 Dec 14;3(113):113ra124.
doi: 10.1126/scitranslmed.3002922. Epub 2011 Nov 30.

An NKG2D-mediated human lymphoid stress surveillance response with high interindividual variation

Affiliations

An NKG2D-mediated human lymphoid stress surveillance response with high interindividual variation

Seema Shafi et al. Sci Transl Med. .

Abstract

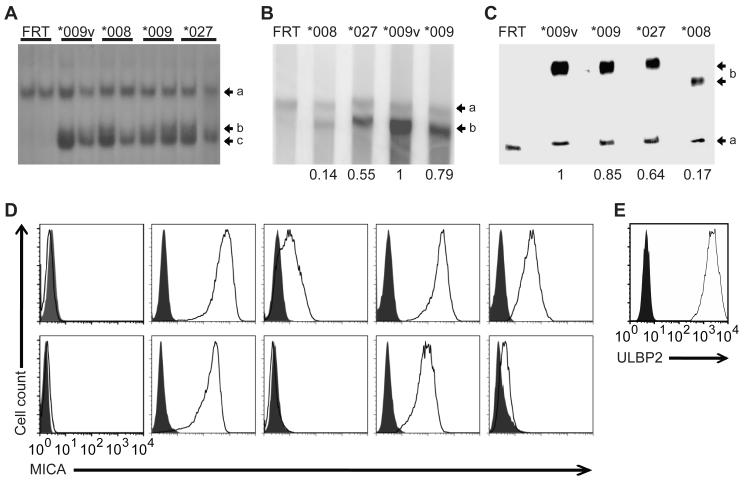
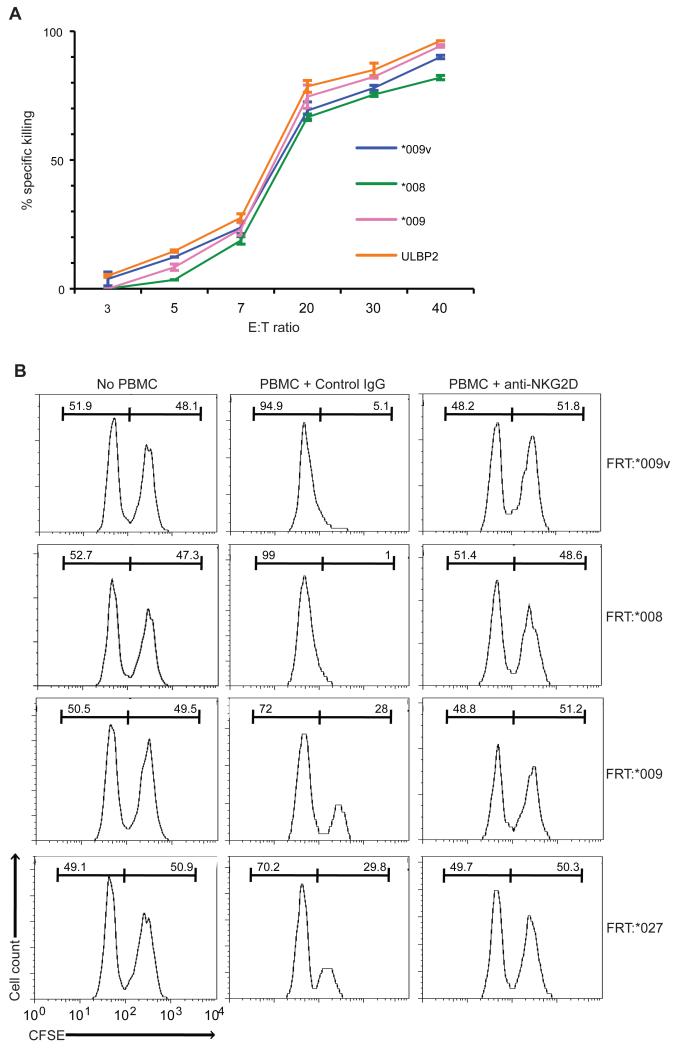
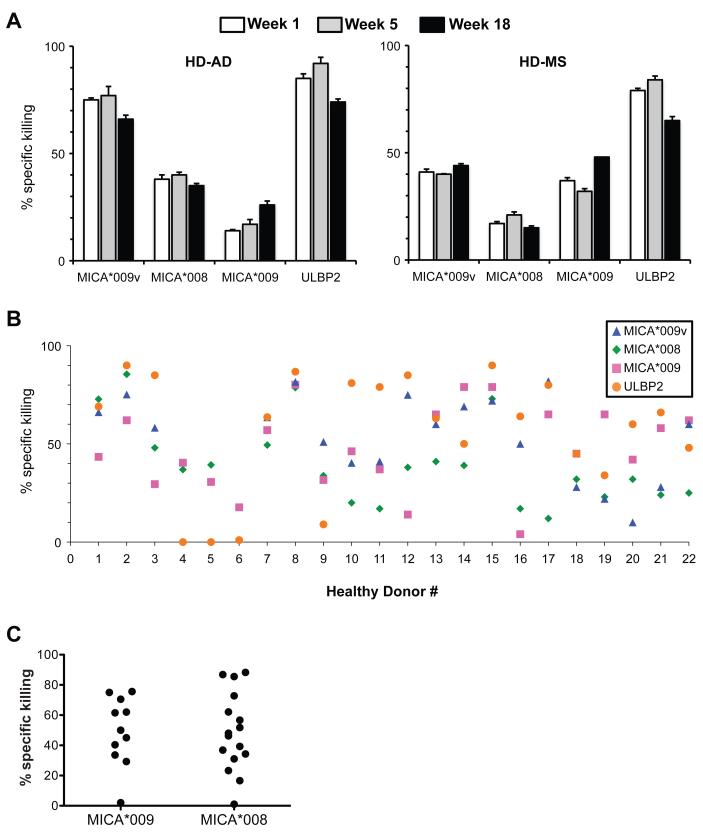
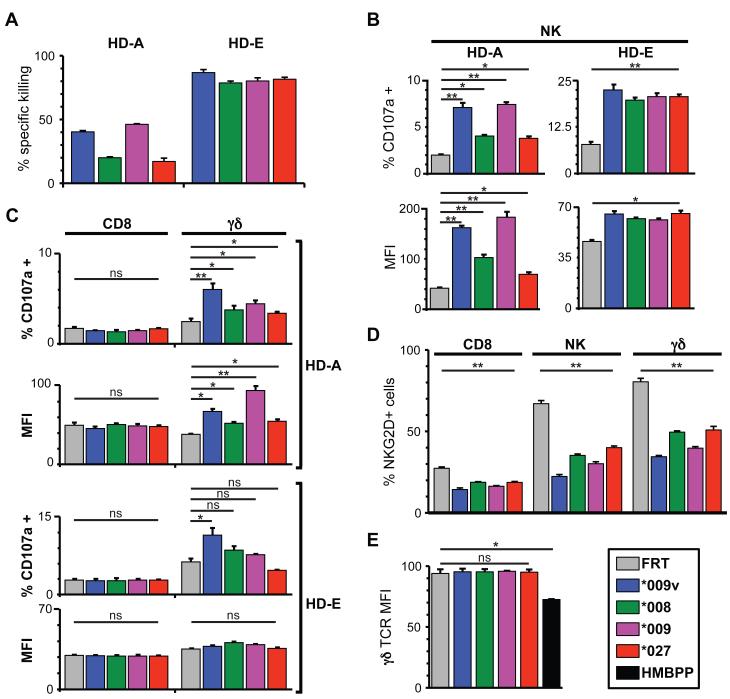
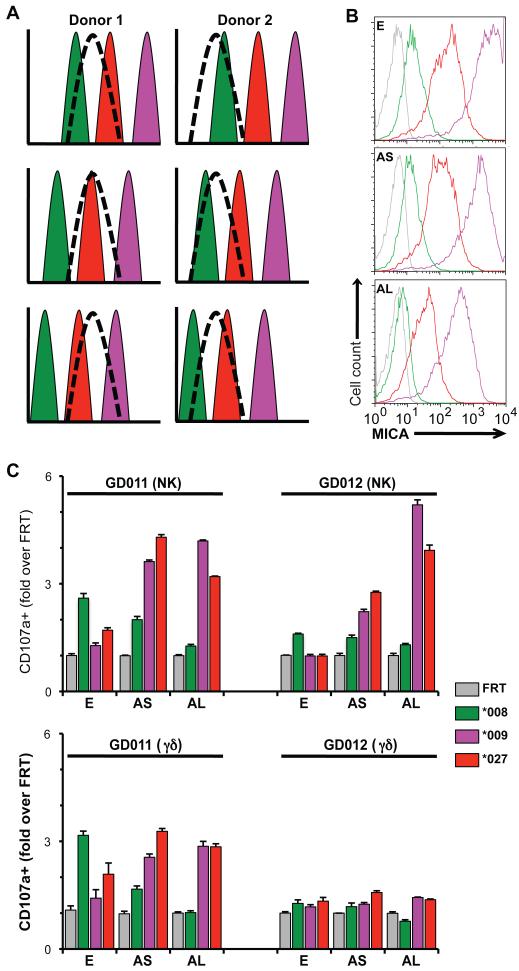
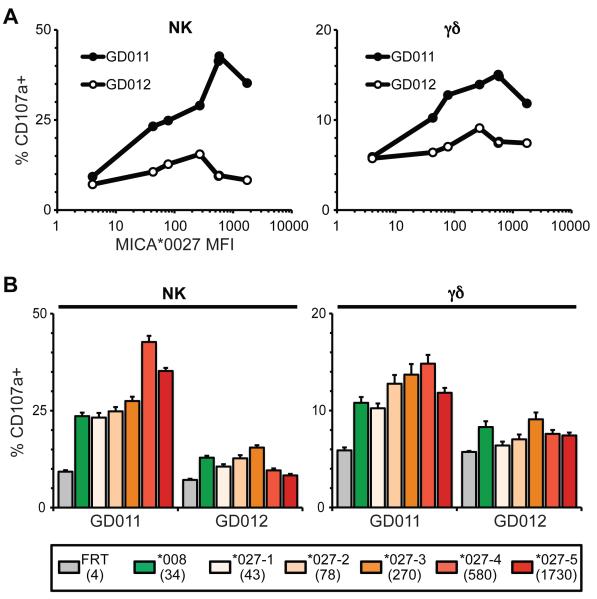
DNA damage or other physicochemical stresses may increase the expression of major histocompatibility complex class I-related stress antigens, which then activate lymphocytes. This lymphoid stress surveillance (LSS) not only can limit tumor formation but may also promote immunopathology. MICA is a highly polymorphic human stress antigen implicated in tumor surveillance, inflammation, and transplant rejection. However, LSS has not been conclusively demonstrated in humans, and the functional role for MICA polymorphisms remains to be established. We show that MICA coding sequence polymorphisms substantially affected RNA and protein expression. All donors tested showed LSS responses of γδ T and natural killer cells, but unexpectedly, each was individually "tuned." Hence, some responded optimally to highly expressed alleles, whereas others responded better to lower MICA expression, challenging the orthodoxy that higher stress antigen levels promote greater responsiveness. These individual variations in LSS tuning may help explain patient-specific differences in tumor immune surveillance, transplant rejection, and inflammation, as well as provide insight into immune evasion and immunosuppression.


Figures

Figure 1
Figure 1. Generation and analysis of CHO transfectants
(A) Southern Blot of duplicate BlpI-digested genomic DNA from CHO-FRT cells stably transfected with MICA*009, *009v, *008 and *027 cDNAs (see Fig. S1) probed with full-length MICA cDNA. Arrows: (a) a probe-homologous sequence in the CHO genome; (b) the 5′ flanking region of the integration site detected by those sequences in the MICA cDNA probe 5′ to the BlpI site; (c) the 4,745bp fragment diagnostic for MICA cDNA integration into the FRT site. (B) Northern blot of 10μg of RNA run on a formaldehyde gel, probed simultaenously for β-actin mRNA [(a) 1892 bp] and MICA mRNA [(b) 1201 bp]. Numbers reflect quantitation normalized to β-actin and relative to MICA*009v, determined by image scanning. (C) Western blot analysis of 10μg of cell lysates loaded on a 4-20% polyacrylamide gradient gel; transferred to nitorcellulose and probed simultaneously with anti-antibodies for β-actin and MICA, for which detected bands (a) (b) migrated at the sizes generally observed (β-actin, 47kD; MICA, 76kD; MICA*008, 71kD). Quantification was performed as above. (D) MICA expression of denoted stable CHO-FRT transfectants as assessed by flow cytometry on intact (upper panels) or permeabilized cells (lower panels). Shaded histograms correspond to isotype control stainings. (E) Cell surface expression of CHO cells stably transfected with ULBP2.
Figure 2
Figure 2. Efficient NKG2D-mediated killing of MICA and ULBP2 transfectants
(A) Killing over a 12h period of CHO-MICA and -ULBP2 cells by NKL cells at indicated E:T ratios for 12 hours, assessed by CFSE. Specific killing determined by flow cytometry of the resultant control : transfectant ratio, relative to input. Data are means of a triplicate experiment +/− SD. (B) CFSE assay performed as described except that PBMC from a healthy donor were used (20:1 E:T ratio). Percentages of CFSE-stained control and transfected cells (listed above each histogram) were recorded before adding PBMC (left panels) and 12h after co-culture in the presence of isotype control (middle panels) or blocking mouse anti-human NKG2D antibody (10μg/mL, right panels).
Figure 3
Figure 3. Stable donor-dependent variation in killing target cells
(A) Killing of transfectants by PBMC of two healthy donors at three time points, as measured by CFSE assay, as in Fig. 2B. (B) Killing assay data from 22 healthy donors (not all donors were tested against all targets). (C) Killing of MICA*009 or MICA*008 targets was further analyzed for MICA*009 or MICA*008 heterozygous or homozygous donors. All data are means of triplicate experiments. SD was consistently <5%, but is not shown so as to preserve the clarity of the figures.
Figure 4
Figure 4. Identification of effector subsets that target transfectants
(A) CFSE assay data for two donors (HD-A; HD-E), as described in Fig. 3. (B) CD107a data for the same two donors (HD-A; HD-E); target cells were incubated with PBMC (1:1) for 5h in the presence of a PE anti-CD107a antibody. Cells were then stained with APC-anti-CD3 to exclude T cells and FITC-anti-CD56 to identify NK cells and the percentage of activated cells (CD107a(+), top panel) and their mean fluorescence intensity (MFI, lower panel) measured by flow cytometry. (C) Cells from the assay performed in (B) were also stained with APC-anti-CD3 and FITC-anti-CD8 or APC-antiCD3 and FITC-anti-pan γδ TCR. (D) NKG2D downregulation assessed by staining PBMC with PE anti-NKG2D after 5h incubation with target cells and staining for specific subpopulations, as described in (B) and (C). (E) Surface TCR-staining of γδ T cells that had been incubated with the indicated transfectants or with HMBPP. All results are means of triplicate stimnulations +/− SD, representative of six donors. *: p<0.05, **: p<0.01, ns: not significant (Student’s t-test).
Figure 5
Figure 5. Contribution of tuning to the preferential recognition of MICA alleles
(A) Model for a bell-shaped response of effector cells from 2 donors tuned to different ranges (dashed curves) of MICA expression levels, set against the levels of MICA expressed by CHO-MICA*008 (green), CHO-MICA*027 (red), and CHO-MICA*009 (purple) cells (top panels). As the expression of these allelic forms is gradually reduced (middle and bottom panels), the capacity to be targeted by donor 1 and donor 2 effector cells is increased for MICA*027 and MICA*009 cells while targeting of MICA*008 cells is decreased. (B) CHO cells were collected with PBS-10mM EDTA (E) or following a short (5min, AS) or long (20min, AL) treatment with Accutase and stained for cell surface MICA expression. Colors coded according to key box shown. (C) Target cells from panel B were utilized in a CD107a assay with NK (top panel) and γδ T cells (bottom panels) from two healthy donors (GD011 and GD012). Responses were normalized to the percentage of CD107a(+) cells in the presence of control vector-transfected FRT cells. Data are means of triplicate stimulations +/− SD.
Figure 6
Figure 6. Quantitative and Qualitative aspects of responses to CHO-MICA cells
(A) MICA*027 was subcloned into the pcDNA3.1 vector to generate stable cloned cell lines with a spectrum of MICA expression. Such clones were assessed for their capacity to stimulate CD107a upregulation by NK cells (left panel) and γδ T cells (right panel) as a function of MICA expression levels (x-axis): cells from the same donors as in Fig. 5. SD is not shown to improve figure clarity but was consistently <5%. (B) Comparison of responses of NK cells (left panel) and γδ T cells (right panel) to the different MICA*027 clones as well as to the MICA*008 cell line. Numbers in parentheses indicate the MICA MFI measured by flow cytometry. Data are means of triplicate stimulations +/− SD.

Comment in

References

    1. Gleimer M, Parham P. Stress management: MHC class I and class I-like molecules as reporters of cellular stress. Immunity. 2003;19:469–477. - PubMed
    1. Hayday AC. Gammadelta T cells and the lymphoid stress-surveillance response. Immunity. 2009;31:184–196. - PubMed
    1. Strid J, et al. Acute upregulation of an NKG2D ligand promotes rapid reorganization of a local immune compartment with pleiotropic effects on carcinogenesis. Nat Immunol. 2008;9:146–154. - PubMed
    1. Fernandez-Messina L, et al. Differential mechanisms of shedding of the glycosylphosphatidylinositol (GPI)-anchored NKG2D ligands. J Biol Chem. 2010;285:8543–8551. - PMC - PubMed
    1. Waldhauer I, et al. Tumor-associated MICA is shed by ADAM proteases. Cancer Res. 2008;68:6368–6376. - PubMed

Publication types

MeSH terms

Substances

LinkOut - more resources