A decrease in DKK1, a WNT inhibitor, contributes to placental lipid accumulation in an obesity-prone rat model
- PMID: 22133691
- PMCID: PMC6584127
- DOI: 10.1095/biolreprod.111.094482
A decrease in DKK1, a WNT inhibitor, contributes to placental lipid accumulation in an obesity-prone rat model
Abstract
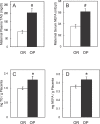
Placenta, as the sole transport mechanism between mother and fetus, links the maternal physical state and the immediate as well as lifelong outcomes of the offspring. The present study examined the consequences of maternal obesity on placental lipid accumulation and metabolism. Pregnant obesity-prone (OP) and obesity-resistant (OR) rat strains were fed a control diet throughout gestation. Placentas were collected on Gestational Day 21 for mRNA and oxidative stress analysis, and frozen placental sections were analyzed for fat accumulation as well as beta-catenin and Dickkopf homolog 1 (Xenopus laevis) (DKK1) localization. JEG3 trophoblast cells were cultured in vitro to determine the relationship between DKK1 and lipid accumulation. Maternal plasma and placental nonesterified fatty acids and triglycerides (TG) were elevated in OP dams. Placental Dkk1 mRNA content was 4-fold lower in OP placentas, and a significant increase was noted in beta-catenin accumulation as well as in mRNA content of fat transport and TG synthesis genes, including Ppard (peroxisome proliferator-activated receptor delta), Slc27a1 (fatty acid transport protein 1; also known as Fatp1), Cd36 (cluster of differentiation 36; also known as fatty acid translocation [Fat]), Lipin1, and Lipin3. Significant lipid accumulation was found within the decidual zones in OP, but not OR, placentas, and thickness of the decidual and junctional zones was significantly smaller in OP than in OR placentas. Overexpression of DKK1 in JEG3 cells decreased lipid accumulation and mRNA content of PPARD, SLC27A1, CD36, LIPIN1, and LIPIN3. Our results demonstrate that DKK1 is regulating certain aspects of placental lipid metabolism through the WNT signaling pathway.
Figures


Similar articles
-
Increased placental fatty acid transporter 6 and binding protein 3 expression and fetal liver lipid accumulation in a mouse model of obesity in pregnancy.Am J Physiol Regul Integr Comp Physiol. 2015 Dec 15;309(12):R1569-77. doi: 10.1152/ajpregu.00385.2015. Epub 2015 Oct 21. Am J Physiol Regul Integr Comp Physiol. 2015. PMID: 26491104 Free PMC article.
-
Maternal High-Fat Feeding Increases Placental Lipoprotein Lipase Activity by Reducing SIRT1 Expression in Mice.Diabetes. 2015 Sep;64(9):3111-20. doi: 10.2337/db14-1627. Epub 2015 May 6. Diabetes. 2015. PMID: 25948680 Free PMC article.
-
The effect of maternal obesity on fatty acid transporter expression and lipid metabolism in the full-term placenta of lean breed swine.J Anim Physiol Anim Nutr (Berl). 2018 Feb;102(1):e242-e253. doi: 10.1111/jpn.12735. Epub 2017 May 15. J Anim Physiol Anim Nutr (Berl). 2018. PMID: 28508539
-
Placental fatty acid transport in maternal obesity.J Dev Orig Health Dis. 2012 Dec;3(6):409-14. doi: 10.1017/S2040174412000414. J Dev Orig Health Dis. 2012. PMID: 25084293 Review.
-
Altered maternal and placental lipid metabolism and fetal fat development in obesity: Current knowledge and advances in non-invasive assessment.Placenta. 2018 Sep;69:118-124. doi: 10.1016/j.placenta.2018.05.011. Epub 2018 May 26. Placenta. 2018. PMID: 29907450 Review.
Cited by
-
The identification of differentially expressed genes between extremes of placental efficiency in maternal line gilts on day 95 of gestation.BMC Genomics. 2019 Mar 29;20(1):254. doi: 10.1186/s12864-019-5626-0. BMC Genomics. 2019. PMID: 30925895 Free PMC article.
-
Genistein exposure during the early postnatal period favors the development of obesity in female, but not male rats.Toxicol Sci. 2014 Mar;138(1):161-74. doi: 10.1093/toxsci/kft331. Epub 2013 Dec 21. Toxicol Sci. 2014. PMID: 24361872 Free PMC article.
-
Maternal obesity and placental function: impaired maternal-fetal axis.Arch Gynecol Obstet. 2024 Jun;309(6):2279-2288. doi: 10.1007/s00404-024-07462-w. Epub 2024 Mar 18. Arch Gynecol Obstet. 2024. PMID: 38494514 Free PMC article. Review.
-
Placental function in maternal obesity.Clin Sci (Lond). 2020 Apr 30;134(8):961-984. doi: 10.1042/CS20190266. Clin Sci (Lond). 2020. PMID: 32313958 Free PMC article. Review.
-
Placental Malfunction, Fetal Survival and Development Caused by Sow Metabolic Disorder: The Impact of Maternal Oxidative Stress.Antioxidants (Basel). 2023 Feb 2;12(2):360. doi: 10.3390/antiox12020360. Antioxidants (Basel). 2023. PMID: 36829919 Free PMC article. Review.
References
-
- Huda SS, Brodie LE, Sattar N. Obesity in pregnancy: prevalence and metabolic consequences. Semin Fetal Neonatal Med 2010; 15:70–76. - PubMed
-
- Seidell JC. Obesity, insulin resistance and diabetes—a worldwide epidemic. Br J Nutr 2000; 83(suppl 1):S5–S8. - PubMed
-
- Stewart FM, Freeman DJ, Ramsay JE, Greer IA, Caslake M, Ferrell WR. Longitudinal assessment of maternal endothelial function and markers of inflammation and placental function throughout pregnancy in lean and obese mothers. J Clin Endocrinol Metab 2007; 92:969–975. - PubMed
MeSH terms
Substances
LinkOut - more resources
Full Text Sources
Medical
Research Materials
Miscellaneous

