Abnormal telomere shortening of peripheral blood mononuclear cells and granulocytes in patients with chronic idiopathic neutropenia
- PMID: 22133767
- PMCID: PMC3342978
- DOI: 10.3324/haematol.2011.053983
Abnormal telomere shortening of peripheral blood mononuclear cells and granulocytes in patients with chronic idiopathic neutropenia
Abstract
Background: Chronic idiopathic neutropenia is characterized by immune-mediated suppression of neutrophil production. Because patients with immune-mediated bone marrow failure syndromes display age-inappropriate telomere shortening in leukocytes, we investigated telomere lengths in peripheral blood mononuclear cells and granulocytes of patients with chronic idiopathic neutropenia.
Design and methods: We studied 37 patients with chronic idiopathic neutropenia and 68 age- and sex-matched healthy controls. Relative telomere length and telomerase reverse transcriptase expression were assessed by a quantitative real time polymerase chain reaction. Telomerase activity was determined by a polymerase chain reaction-based immunoassay.
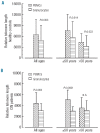
Results: The mean relative telomere values of peripheral blood mononuclear cells and granulocytes were significantly lower in patients compared to controls, and significantly lower than expected on the basis of the age-adjusted healthy control distribution. The difference in the relative telomere lengths between patients and controls in both peripheral blood mononuclear cells and granulocytes was prominent in those under the age of 50 years. Contrary to the peripheral blood mononuclear cells, in which an inverse correlation was observed between relative telomere values and age, no significant correlation was noted between granulocyte telomere values and patient age. A significant correlation was observed between individual relative telomere values and absolute neutrophil counts. There was no difference in expression of telomerase reverse transcriptase in peripheral blood mononuclear cells between patients and controls but telomerase activity was identified at a significantly higher frequency in controls than in patients. No correlation was found between telomerase activity or telomerase reverse transcriptase expression and relative telomere lengths of peripheral blood mononuclear cells.
Conclusions: Patients with chronic idiopathic neutropenia display age-inappropriate telomere shortening of peripheral blood cells and low telomerase activity in peripheral blood mononuclear cells. A compensatory increased proliferation of bone marrow hematopoietic progenitor cells in association with lymphocyte replicative exhaustion probably account for these abnormalities.
Figures


Similar articles
-
Telomerase activity increased and telomere length shortened in peripheral blood cells from patients with immune thrombocytopenia.J Clin Immunol. 2013 Apr;33(3):577-85. doi: 10.1007/s10875-012-9848-z. Epub 2012 Dec 14. J Clin Immunol. 2013. PMID: 23239407
-
Telomere Length in Peripheral Blood Mononuclear Cells of Patients on Chronic Hemodialysis Is Related With Telomerase Activity and Treatment Duration.Artif Organs. 2015 Sep;39(9):756-64. doi: 10.1111/aor.12453. Epub 2015 Apr 20. Artif Organs. 2015. PMID: 25894013
-
Telomere dysfunction in peripheral blood mononuclear cells from patients with primary biliary cirrhosis.Dig Liver Dis. 2014 Apr;46(4):363-8. doi: 10.1016/j.dld.2013.11.008. Epub 2013 Dec 27. Dig Liver Dis. 2014. PMID: 24378524
-
Accelerated telomere shortening in leukocyte subpopulations of patients with coronary heart disease: role of cytomegalovirus seropositivity.Circulation. 2009 Oct 6;120(14):1364-72. doi: 10.1161/CIRCULATIONAHA.109.854299. Epub 2009 Sep 21. Circulation. 2009. PMID: 19770396
-
Telomere length variation and telomerase activity expression in patients with congenital and acquired aplastic anemia.Acta Haematol. 2004;111(3):125-31. doi: 10.1159/000076519. Acta Haematol. 2004. PMID: 15034232 Review.
Cited by
-
Shorter Granulocyte Telomeres Among Children and Adolescents With Perinatally Acquired Human Immunodeficiency Virus Infection and Chronic Lung Disease in Zimbabwe.Clin Infect Dis. 2021 Oct 5;73(7):e2043-e2051. doi: 10.1093/cid/ciaa1134. Clin Infect Dis. 2021. PMID: 32766884 Free PMC article.
-
Transgenic rat model of childhood-onset dermatitis by overexpressing telomerase reverse transcriptase (TERT).Transgenic Res. 2016 Aug;25(4):413-24. doi: 10.1007/s11248-016-9939-3. Epub 2016 Feb 17. Transgenic Res. 2016. PMID: 26885830
-
Differential expression of cell cycle and WNT pathway-related genes accounts for differences in the growth and differentiation potential of Wharton's jelly and bone marrow-derived mesenchymal stem cells.Stem Cell Res Ther. 2017 Apr 26;8(1):102. doi: 10.1186/s13287-017-0555-9. Stem Cell Res Ther. 2017. PMID: 28446235 Free PMC article.
-
n-3 Fatty Acid Supplementation and Leukocyte Telomere Length in Patients with Chronic Kidney Disease.Nutrients. 2016 Mar 19;8(3):175. doi: 10.3390/nu8030175. Nutrients. 2016. PMID: 27007392 Free PMC article. Clinical Trial.
References
-
- Dale DC, Guerry D, Wewerka JR, Bull JM, Chusid MJ. Chronic neutropenia. Medicine (Baltimore) 1979;58(2):128–44. - PubMed
-
- Papadaki HA, Palmblad J, Eliopoulos GD. Non-immune chronic idiopathic neutropenia of adult: an overview. Eur J Haematol. 2001;67(1):35–44. - PubMed
-
- Papadaki HA, Eliopoulos AG, Kosteas T, Gemetzi C, Damianaki A, Koutala H, et al. Impaired granulocytopoiesis in patients with chronic idiopathic neutropenia is associated with increased apoptosis of bone marrow myeloid progenitor cells. Blood. 2003;101(7):2591–600. - PubMed
-
- Papadaki HA, Giouremou K, Eliopoulos GD. Low frequency of myeloid progenitor cells in chronic idiopathic neutropenia of adults may be related to increased production of TGF-beta1 by bone marrow stromal cells. Eur J Haematol. 1999;63(3):154–62. - PubMed
-
- Mavroudi I, Papadaki V, Pyrovolaki K, Katonis P, Eliopoulos AG, Papadaki HA. The CD40/CD40 ligand interactions exert pleiotropic effects on bone marrow granulopoiesis. J Leukoc Biol. 2011;89(5):771–83. - PubMed
Publication types
MeSH terms
Substances
Supplementary concepts
LinkOut - more resources
Full Text Sources

