

Microbial diversity of biofilm communities in microniches associated with the didemnid ascidian Lissoclinum patella
- PMID: 22134643
- PMCID: PMC3358027
- DOI: 10.1038/ismej.2011.181
Microbial diversity of biofilm communities in microniches associated with the didemnid ascidian Lissoclinum patella
Abstract
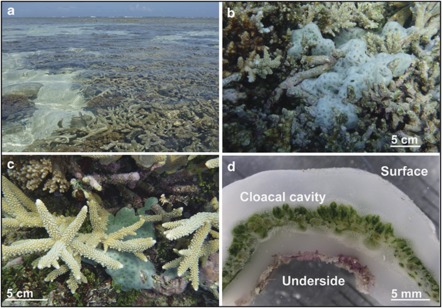
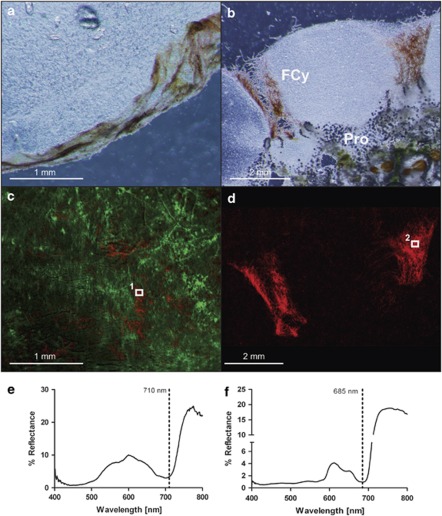
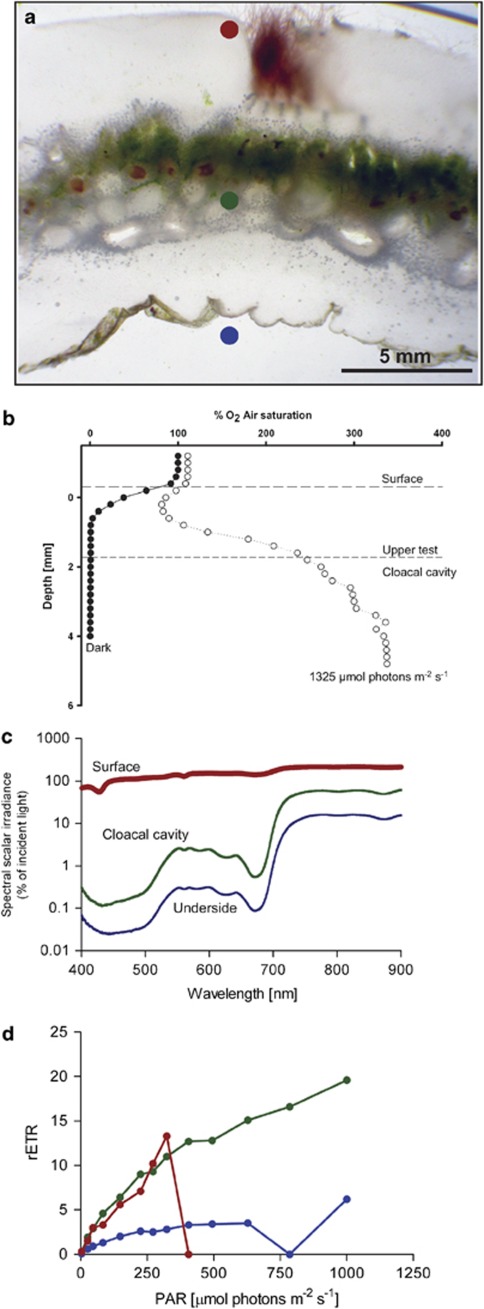
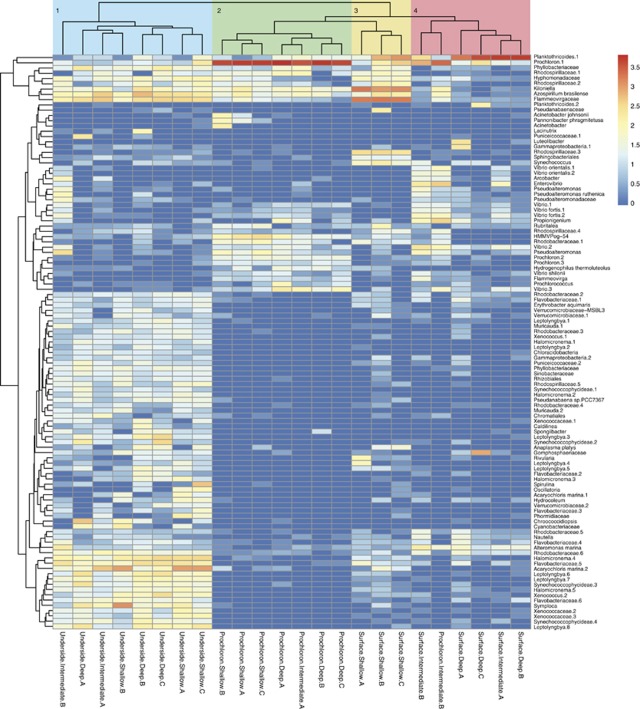
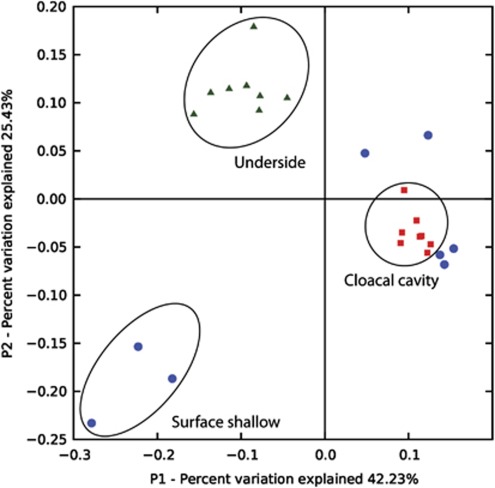
We assessed the microbial diversity and microenvironmental niche characteristics in the didemnid ascidian Lissoclinum patella using 16S rRNA gene sequencing, microsensor and imaging techniques. L. patella harbors three distinct microbial communities spatially separated by few millimeters of tunic tissue: (i) a biofilm on its upper surface exposed to high irradiance and O(2) levels, (ii) a cloacal cavity dominated by the prochlorophyte Prochloron spp. characterized by strong depletion of visible light and a dynamic chemical microenvironment ranging from hyperoxia in light to anoxia in darkness and (iii) a biofilm covering the underside of the animal, where light is depleted of visible wavelengths and enriched in near-infrared radiation (NIR). Variable chlorophyll fluorescence imaging demonstrated photosynthetic activity, and hyperspectral imaging revealed a diversity of photopigments in all microhabitats. Amplicon sequencing revealed the dominance of cyanobacteria in all three layers. Sequences representing the chlorophyll d containing cyanobacterium Acaryochloris marina and anoxygenic phototrophs were abundant on the underside of the ascidian in shallow waters but declined in deeper waters. This depth dependency was supported by a negative correlation between A. marina abundance and collection depth, explained by the increased attenuation of NIR as a function of water depth. The combination of microenvironmental analysis and fine-scale sampling techniques used in this investigation gives valuable first insights into the distribution, abundance and diversity of bacterial communities associated with tropical ascidians. In particular, we show that microenvironments and microbial diversity can vary significantly over scales of a few millimeters in such habitats; which is information easily lost by bulk sampling.
Figures

Similar articles
-
Microenvironmental Ecology of the Chlorophyll b-Containing Symbiotic Cyanobacterium Prochloron in the Didemnid Ascidian Lissoclinum patella.Front Microbiol. 2012 Nov 30;3:402. doi: 10.3389/fmicb.2012.00402. eCollection 2012. Front Microbiol. 2012. PMID: 23226144 Free PMC article.
-
Microenvironment and phylogenetic diversity of Prochloron inhabiting the surface of crustose didemnid ascidians.Environ Microbiol. 2015 Oct;17(10):4121-32. doi: 10.1111/1462-2920.12983. Epub 2015 Aug 11. Environ Microbiol. 2015. PMID: 26176189
-
Cyanobacterial diversity and a new acaryochloris-like symbiont from Bahamian sea-squirts.PLoS One. 2011;6(8):e23938. doi: 10.1371/journal.pone.0023938. Epub 2011 Aug 22. PLoS One. 2011. PMID: 21915246 Free PMC article.
-
Possible Functional Roles of Patellamides in the Ascidian-Prochloron Symbiosis.Mar Drugs. 2022 Feb 2;20(2):119. doi: 10.3390/md20020119. Mar Drugs. 2022. PMID: 35200648 Free PMC article. Review.
-
Ascidian photosymbiosis: diversity of cyanobacterial transmission during embryogenesis.Genesis. 2015 Jan;53(1):121-31. doi: 10.1002/dvg.22778. Epub 2014 Apr 15. Genesis. 2015. PMID: 24700539 Review.
Cited by
-
Biofilm growth and near-infrared radiation-driven photosynthesis of the chlorophyll d-containing cyanobacterium Acaryochloris marina.Appl Environ Microbiol. 2012 Jun;78(11):3896-904. doi: 10.1128/AEM.00397-12. Epub 2012 Mar 30. Appl Environ Microbiol. 2012. PMID: 22467501 Free PMC article.
-
Distinct microbial communities in an ascidian-crustacean symbiosis.Environ Microbiol Rep. 2024 Feb;16(1):e13242. doi: 10.1111/1758-2229.13242. Environ Microbiol Rep. 2024. PMID: 38383831 Free PMC article.
-
Microenvironmental Ecology of the Chlorophyll b-Containing Symbiotic Cyanobacterium Prochloron in the Didemnid Ascidian Lissoclinum patella.Front Microbiol. 2012 Nov 30;3:402. doi: 10.3389/fmicb.2012.00402. eCollection 2012. Front Microbiol. 2012. PMID: 23226144 Free PMC article.
-
Down under the tunic: bacterial biodiversity hotspots and widespread ammonia-oxidizing archaea in coral reef ascidians.ISME J. 2014 Mar;8(3):575-588. doi: 10.1038/ismej.2013.188. Epub 2013 Oct 24. ISME J. 2014. PMID: 24152714 Free PMC article.
-
Response of Milk Performance, Rumen and Hindgut Microbiome to Dietary Supplementation with Aspergillus oryzae Fermentation Extracts in Dairy Cows.Curr Microbiol. 2022 Feb 20;79(4):113. doi: 10.1007/s00284-022-02790-z. Curr Microbiol. 2022. PMID: 35184209
References
-
- Adams D.2002Symbiotic interactionsIn: Whitton B, Potts M (eds).The Ecology of Cyanobacteria1st edn. Springer: Netherlands; 523–561.
-
- Barott KL, Rodriguez-Brito B, Janouškovec J, Marhaver KL, Smith JE, Keeling P, et al. Microbial diversity associated with four functional groups of benthic reef algae and the reef-building coral Montastraea annularis. Environ Microbiol. 2011;13:1192–1204. - PubMed
-
- Bertram A, Pattenden G. Marine metabolites: metal binding and metal complexes of azole-based cyclic peptides of marine origin. Nat Prod Rep. 2007;24:18–30. - PubMed
-
- Böer SI, Hedtkamp SIC, van Beusekom JEE, Fuhrman JA, Boetius A, Ramette A. Time- and sediment depth-related variations in bacterial diversity and community structure in subtidal sands. ISME J. 2009;3:780–791. - PubMed
Publication types
MeSH terms
Substances
LinkOut - more resources
Full Text Sources
Other Literature Sources
Miscellaneous
