Comparative Study
. 2012 Feb;463(2):339-54.
doi: 10.1007/s00424-011-1048-9. Epub 2011 Dec 2.

Post hoc immunostaining of GABAergic neuronal subtypes following in vivo two-photon calcium imaging in mouse neocortex

Affiliations
Comparative Study

Post hoc immunostaining of GABAergic neuronal subtypes following in vivo two-photon calcium imaging in mouse neocortex

Dominik Langer et al. Pflugers Arch. 2012 Feb.

Abstract

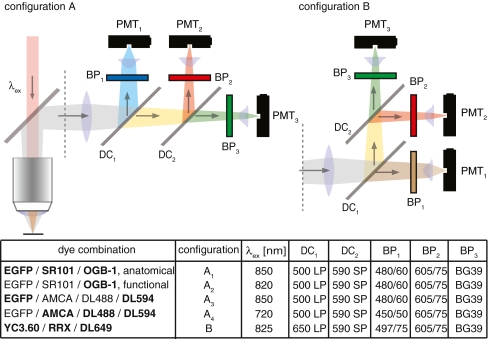
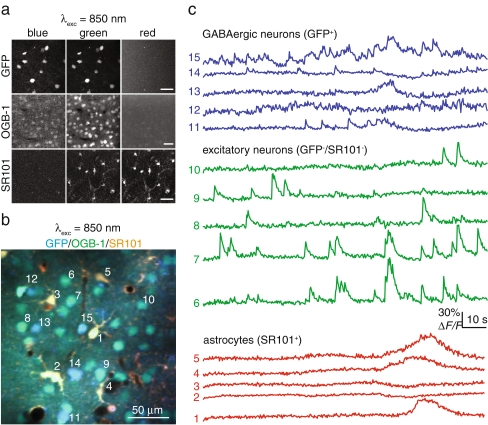
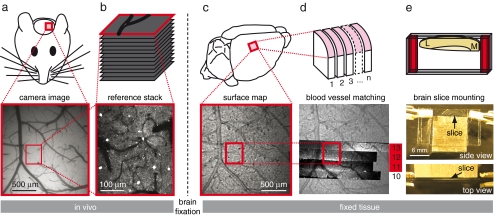
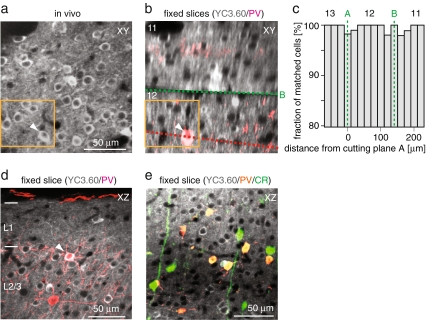
GABAergic neurons in the neocortex are diverse with regard to morphology, physiology, and axonal targeting pattern, indicating functional specializations within the cortical microcircuitry. Little information is available, however, about functional properties of distinct subtypes of GABAergic neurons in the intact brain. Here, we combined in vivo two-photon calcium imaging in supragranular layers of the mouse neocortex with post hoc immunohistochemistry against the three calcium-binding proteins parvalbumin, calretinin, and calbindin in order to assign subtype marker profiles to neuronal activity. Following coronal sectioning of fixed brains, we matched cells in corresponding volumes of image stacks acquired in vivo and in fixed brain slices. In GAD67-GFP mice, more than 95% of the GABAergic cells could be unambiguously matched, even in large volumes comprising more than a thousand interneurons. Triple immunostaining revealed a depth-dependent distribution of interneuron subtypes with increasing abundance of PV-positive neurons with depth. Most importantly, the triple-labeling approach was compatible with previous in vivo calcium imaging following bulk loading of Oregon Green 488 BAPTA-1, which allowed us to classify spontaneous calcium transients recorded in vivo according to the neurochemically defined GABAergic subtypes. Moreover, we demonstrate that post hoc immunostaining can also be applied to wild-type mice expressing the genetically encoded calcium indicator Yellow Cameleon 3.60 in cortical neurons. Our approach is a general and flexible method to distinguish GABAergic subtypes in cell populations previously imaged in the living animal. It should thus facilitate dissecting the functional roles of these subtypes in neural circuitry.


Figures

Fig. 1
Fig. 1
Fluorescence excitation and detection beam paths used for two-photon imaging with different fluorophore combinations. Dyes in bold: visible; non-bold: invisible with the respective excitation/detection scheme. Abbreviations: λ ex excitation wavelength, PMT photo-multiplier tube, BP band-pass filter, DC dichroic mirror, SP short-pass, LP long-pass. Filter wavelengths are specified in nanometers. For BP filters, the center wavelength and the width of the transmission range are given
Fig. 2
Fig. 2
In vivo two-photon calcium imaging with discrimination of three major neocortical cell types. a Separate imaging of GFP, Oregon Green 488 BAPTA-1 (OGB-1), and sulforhodamine 101 (SR101) in three independent experiments, in which only one fluorophore was present (detection scheme A1, Fig. 1). Scale bars = 50 μm. Top row: GFP-positive GABAergic interneurons in a GAD67-GFP mouse were identified by their large contribution to the blue channel (450–500 nm spectral window), but they are also visible in the green channel. Middle row: The OGB-1 signal is strongest in the green channel (500–590 nm) but also partially bleeds through in the blue channel. Bottom row: SR101-stained astrocytes are detected in the green and red channels but are the only cells visible in the red channel (590–650 nm). b Overlay of simultaneously acquired two-photon images in all three spectral channels in an experiment in which OGB-1 and SR101 labeling were applied to the neocortex of a GAD67-GFP mouse. Astrocytes (yellow), excitatory neurons (green), and inhibitory interneurons (blue) can be readily discriminated with this in vivo triple stain. c Spontaneous calcium transients for all three distinguishable cell types for the example cells numbered in b (850 nm excitation wavelength)
Fig. 3
Fig. 3
Preparation of fixed coronal brain slices and registration to the volume of interest. a In vivo large field-of-view camera image of the blood vessel pattern at the cortical surface within a craniotomy in a GAD67-GFP mouse. b High-resolution reference stack acquired in vivo with the two-photon microscope from the region indicated by the red box in a, revealing the subpopulation of GFP-expressing cells. c Large field-of-view two-photon image of the cortical surface originally within the craniotomy captured from the whole brain after perfusion fixation. This additional reference map of the surface blood vessels complements the camera reference map acquired in vivo. d Coronal sectioning of the fixed brain. e Coronal slices were mounted between two cover slips with two strips of cover slip glass as spacers (red). The glass assembly was held together by two clips and glued to a metal bearing. The mount was placed vertically under the two-photon microscope to image the pial surface segments. These segments were registered and overlaid to the two-photon blood vessel reference map as shown in d. In this case, slices 11 to 13 were identified as the slices of interest because they cover the volume contained in the in vivo two-photon reference image stack shown in b (red box)
Fig. 4
Fig. 4
Identifying the same GABAergic neurons in images acquired in vivo and from fixed tissue slices, respectively. a High-resolution reference image stack acquired in vivo from a GAD67-GFP mouse. b Image stacks acquired from coronal slices covering the volume of interest (same slices as in Fig. 3d). c Example coronal XZ view from the marked slice from the stack in b. d Three-dimensional composite view of the in vivo stack and one slice stack following alignment. e Matching the same GFP-expressing neurons in the in vivo reference stack (left) and in the brain slices (right). Note that the brain slice image is an XY view composed from several adjacent slices. Slice borders are indicated by green dashed lines. The dashed red line corresponds to the frame shown in c. Orange boxes highlight example constellations of cells that are easily recognized in both images. Arrow heads point to the same cells as in c. Note that some cells visible on the right are not visible on the left (and vice versa) due to nonlinear tissue distortions that cannot be corrected for by rotation fitting. Focusing through the three-dimensional image stacks is required to obtain the match for each cell. f Fraction of matched GFP-positive cells analyzed in 20-μm bins for the single example volume shown in d. Slice borders are again indicated as dotted green lines. g Pooled analysis of the average fraction of matched cells as a function of distance from the closest cutting plane. The number of slices considered is specified for each bin (slices from four mice; error bars indicate standard error of the mean (SEM))
Fig. 5
Fig. 5
Post hoc triple immunostaining of calcium-binding marker proteins in populations of GABAergic interneurons imaged in vivo. a Superficial cortical layers in a coronal slice stained for parvalbumin (PV), calretinin (CR), and calbindin (CB). Left: At 850-nm excitation, GFP-positive cells are clearly visible as blue cells while PV-positive neurons appear orange. Right: At 720-nm excitation, the three antibody stains against PV, CR, and CB are visible in the red, green, and blue channel, respectively. b Examples of matched GABAergic interneurons with five different combinations of marker proteins expressed (coronal views from fixed slices; upper left insets: in vivo images of the same, GFP-expressing cells). Scale bars = 20 μm. c Three-dimensional view of an image stack of a large population of GABAergic neurons (874 cells) acquired in vivo with color-coded overlay of the classification determined by post hoc immunostaining: PV+ (red), CR+ (green), CB+ (blue), PV+/CB+ (pink), GFP+ only (gray), and GFP+ but not matched (yellow). The estimated extent of the C2 barrel column located by intrinsic optical imaging is indicated with dashed lines. d Layer dependence of the abundance of GABAergic interneurons expressing different protein marker combinations. The percentage fraction of a specific marker combination from all GFP-positive neurons is shown in 50-μm bins for two volumes from two different animals (left: centered to C2 barrel; right: centered to D2 barrel). CR+/− indicates that the presence or absence of CR cannot be specified with certainty due to channel bleed-through under our conditions
Fig. 6
Fig. 6
Post hoc classification of functional in vivo calcium traces from GABAergic interneurons according to their expression profile of calcium-binding proteins. a Left: Field-of-view in barrel cortex of a GAD67-GFP mouse (150 μm depth below the pia), in which two-photon calcium imaging was performed in vivo. Right: Spontaneous calcium transients recorded in the example cells marked with arrows (14: GABAergic neurons; 58: excitatory neurons). Trace colors indicate the post hoc GABAergic cell classification as revealed in b: light blue, PVCRCB; red, PV+CRCB; green, PVCR+CB; black, non-GABAergic neurons. b The same area reconstructed from triple immunostained coronal slices by means of rotation fitting with 850-nm (left) and 720-nm (right) excitation. A slice border is indicated as a green dotted line. GFP-positive cells without subtype marker staining appear blue in the left image and are invisible on the right. PV-positive cells are orange in the left and red in the right image. CR-positive and CB-positive cells are green or blue, respectively, in the right image. Matching of GABAergic neurons 1 through 4 with the in vivo image in a is indicated. c Collected examples of spontaneous calcium transients observed in two animals for identified GABAergic neurons with different types of marker combinations. All traces are recorded at different time points except for those marked by arrows and stars, respectively
Fig. 7
Fig. 7
Post hoc immunostaining of cortical tissue expressing Yellow Cameleon 3.60 (YC3.60). a In vivo two-photon image of a layer 2/3 neuronal population expressing YC3.60 following viral injection. A particular cell constellation is highlighted by an orange box. b The same cell population in two adjacent fixed slices, rotation-fitted to the in vivo XY view. The anti-PV immunostain is overlaid in red. The green dashed line indicates the slice border. c Fraction of matched cells analyzed for 20-μm bins in a 220 × 370 × 250-μm3 volume (1,427 cells in total). Slice borders are indicated as dotted green lines (slice border B is visible in b). d Coronal side view at the level of the dashed red line in b. The PV-positive cell marked by the arrow head is the same cell marked in the cell constellation in a and b. e Example of anti-PV/anti-CR double immunostaining of YC3.60-expressing cells in the neocortex. In the coronal side view, the bipolar morphology of CR-positive interneurons is evident

Similar articles

Cited by

References

    1. Abramoff MD, Magelhaes PJ, Ram SJ. Image processing with ImageJ. Biophot Int. 2004;11(7):36–42.
    1. Alitto HJ, Dan Y. Function of inhibition in visual cortical processing. Curr Opin Neurobiol. 2010;20(3):340–346. doi: 10.1016/j.conb.2010.02.012. - DOI - PMC - PubMed
    1. Andermann ML, Kerlin AM, Reid RC. Chronic cellular imaging of mouse visual cortex during operant behavior and passive viewing. Front Cell Neurosci. 2010;4:3. - PMC - PubMed
    1. Arun KS, Huang TS, Blostein SD. Least-squares fitting of two 3-D point sets. IEEE Trans Pattern Anal Mach Intell. 1987;9(5):698–700. doi: 10.1109/TPAMI.1987.4767965. - DOI - PubMed
    1. Ascoli GA, Alonso-Nanclares L, Anderson SA, Barrionuevo G, Benavides-Piccione R, Burkhalter A, Buzsáki G, Cauli B, Defelipe J, Fairén A, Feldmeyer D, Fishell G, Fregnac Y, Freund TF, Gardner D, Gardner EP, Goldberg JH, Helmstaedter M, Hestrin S, Karube F, Kisvárday ZF, Lambolez B, Lewis DA, Marin O, Markram H, Muñoz A, Packer A, Petersen CC, Rockland KS, Rossier J, Rudy B, Somogyi P, Staiger JF, Tamas G, Thomson AM, Toledo-Rodriguez M, Wang Y, West DC, Yuste R. Petilla terminology: nomenclature of features of GABAergic interneurons of the cerebral cortex. Nat Rev Neurosci. 2008;9(7):557–568. doi: 10.1038/nrn2402. - DOI - PMC - PubMed

Publication types

MeSH terms

LinkOut - more resources