. 2012 Feb;30(2):210-21.
doi: 10.1002/stem.1002.

Abcg2 expression marks tissue-specific stem cells in multiple organs in a mouse progeny tracking model

Affiliations

Abcg2 expression marks tissue-specific stem cells in multiple organs in a mouse progeny tracking model

Soghra Fatima et al. Stem Cells. 2012 Feb.

Abstract

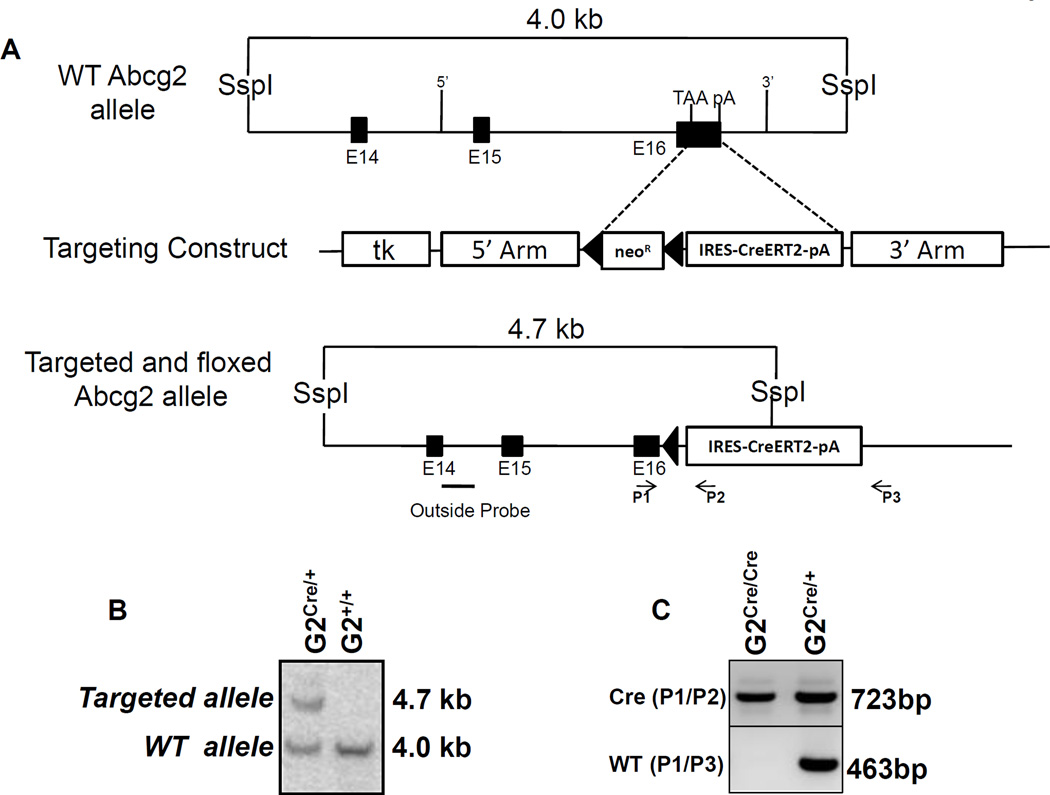
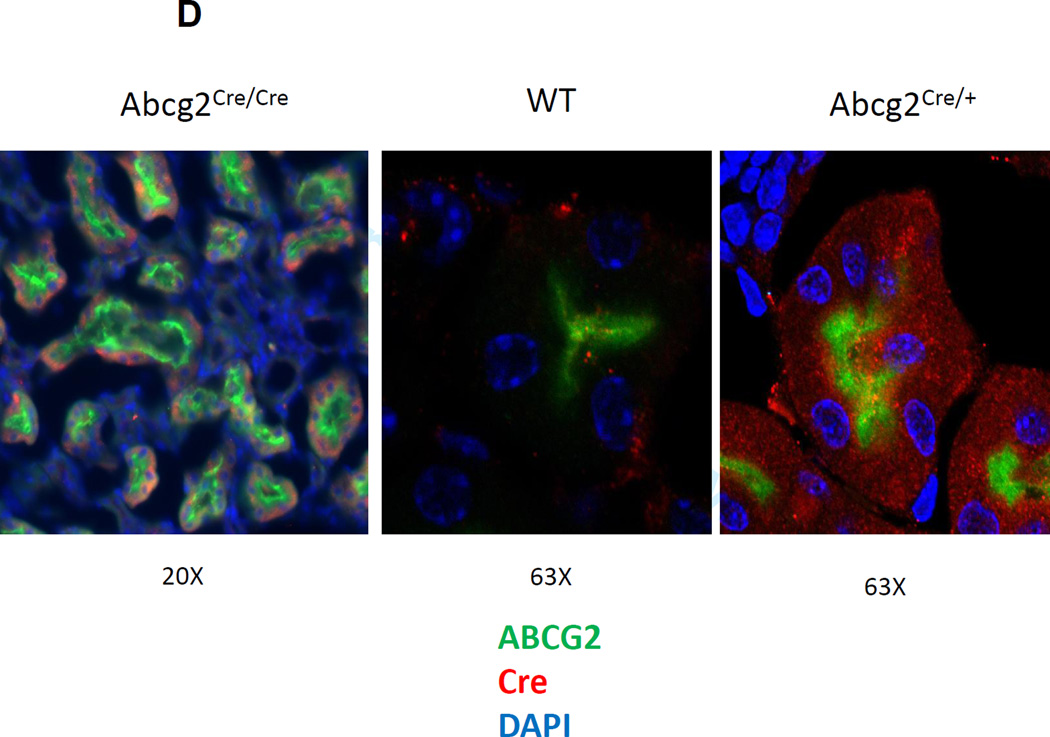
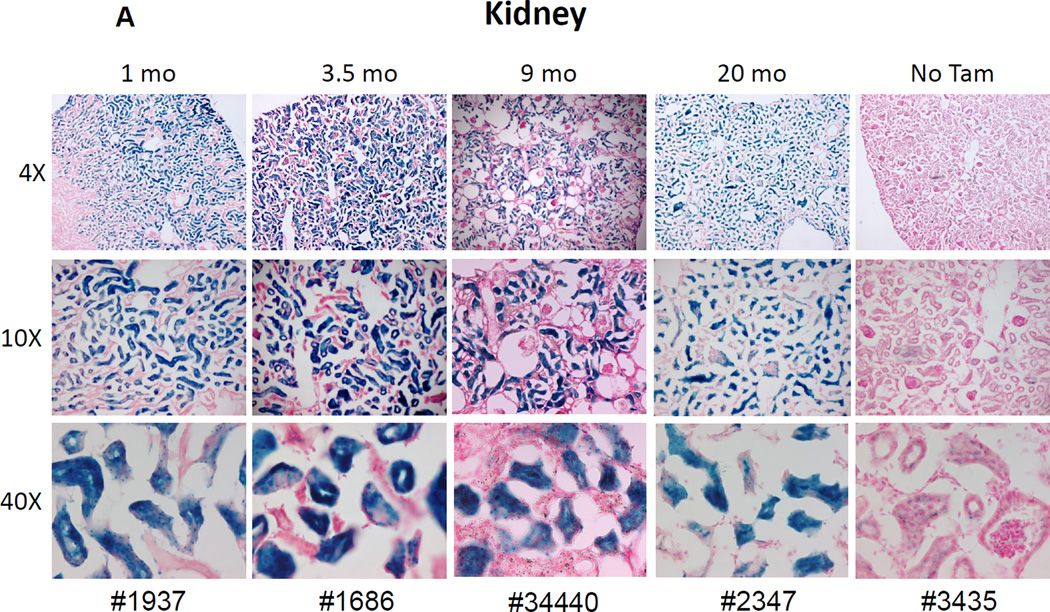
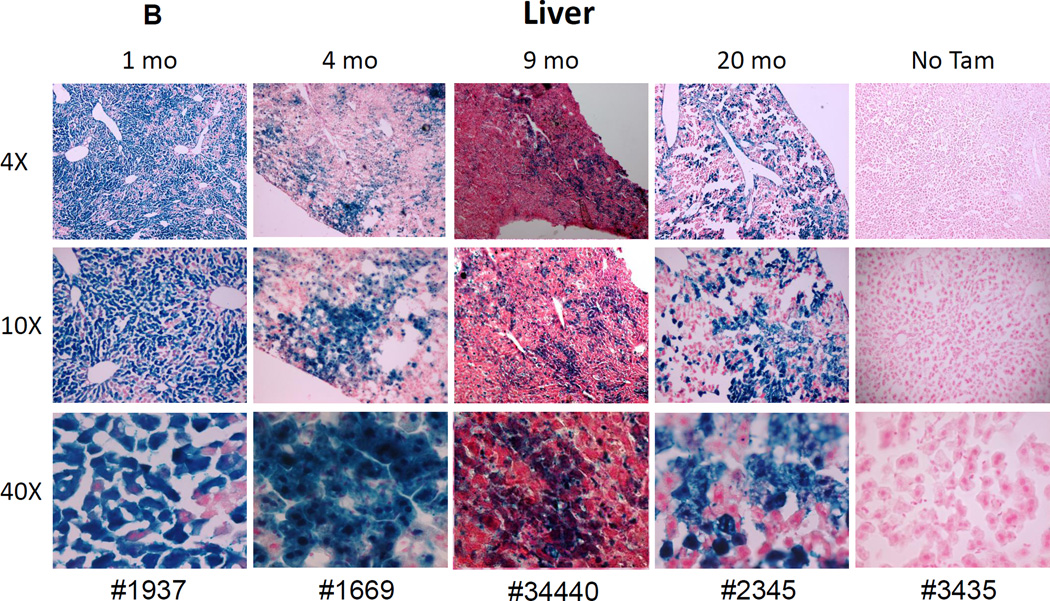
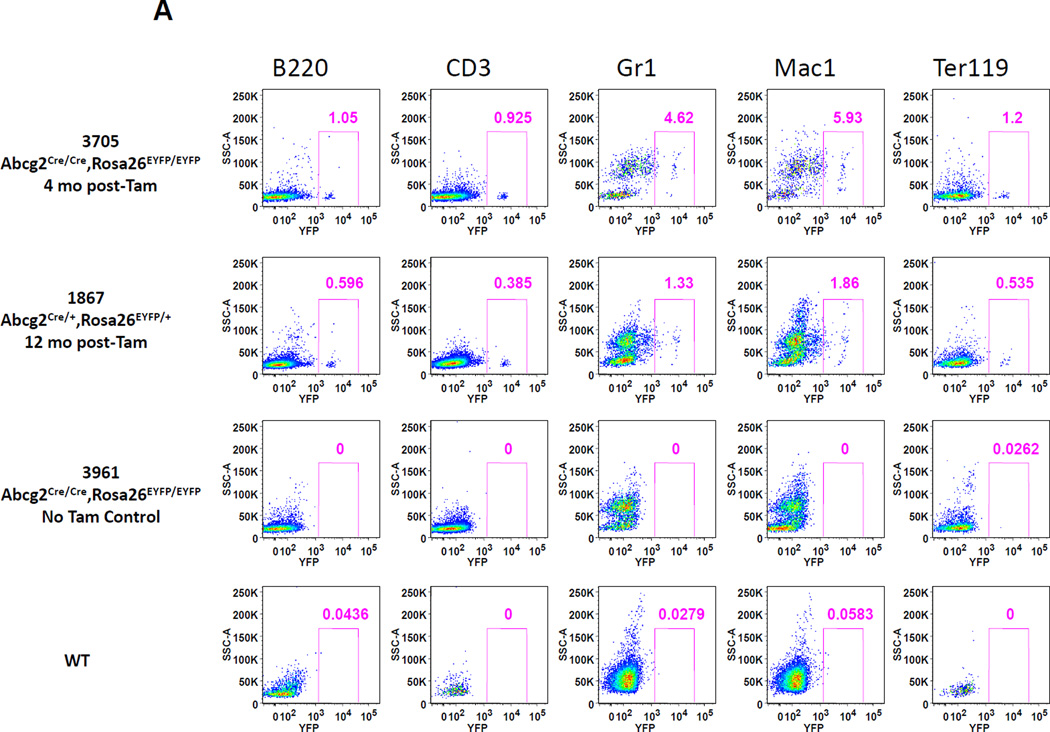
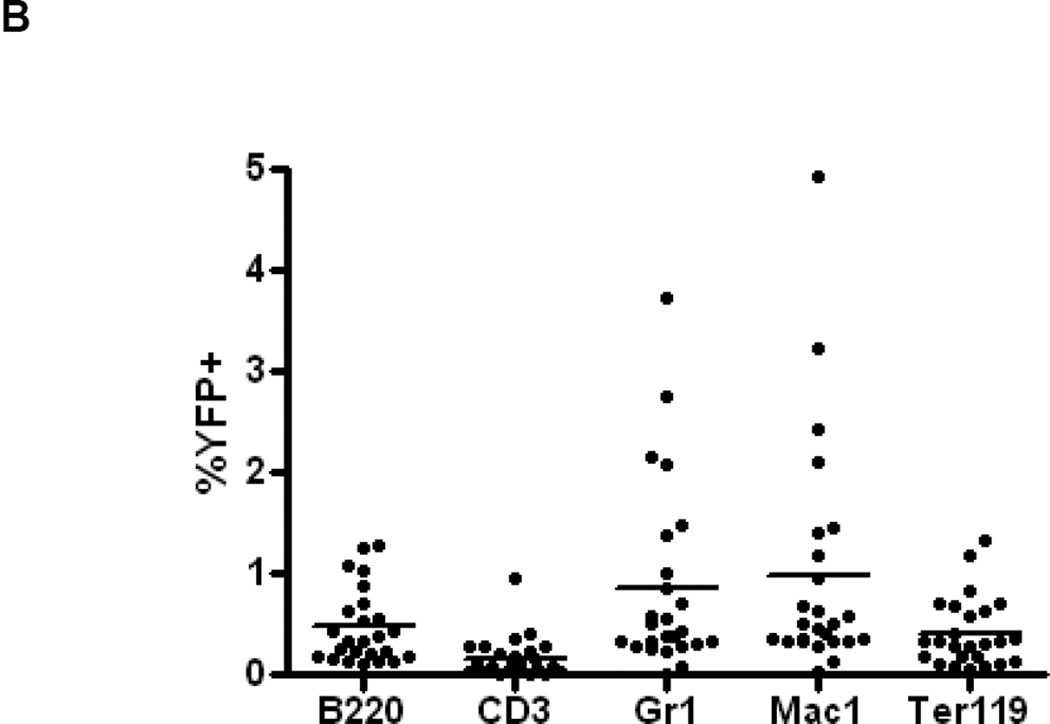
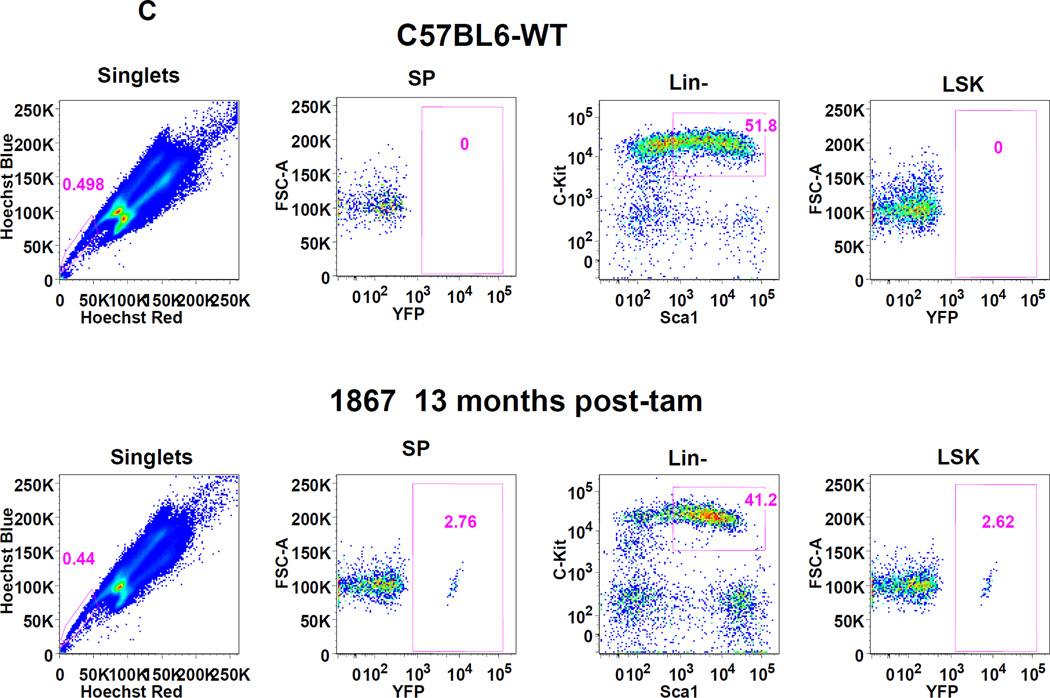
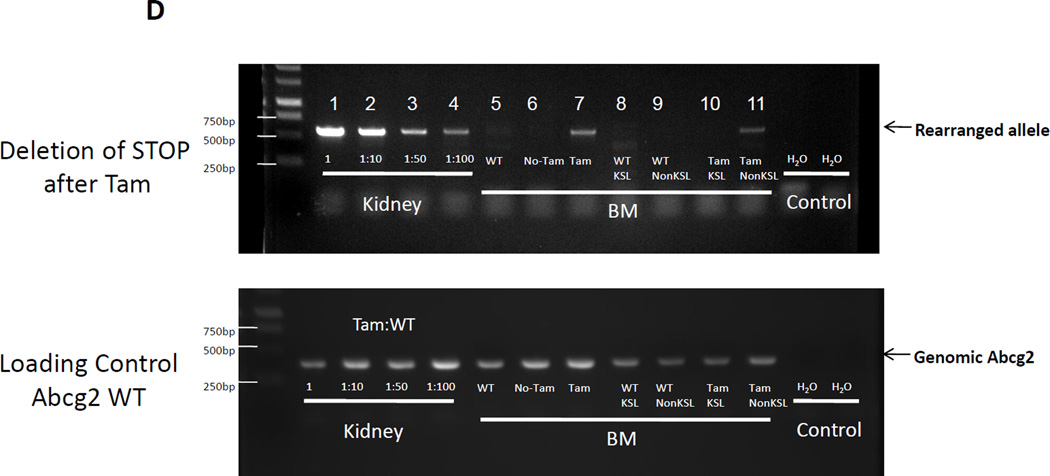
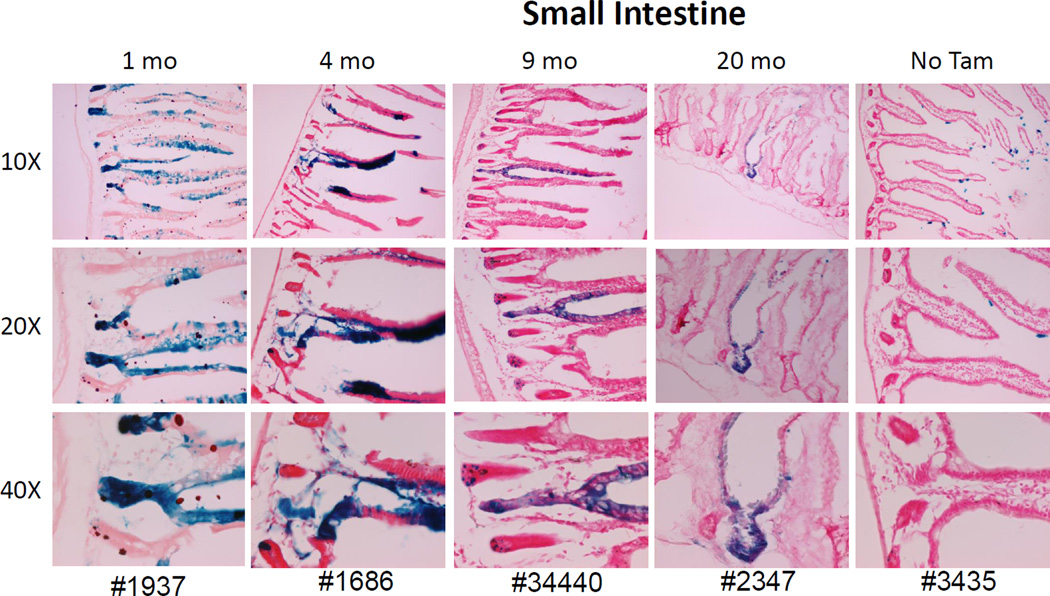
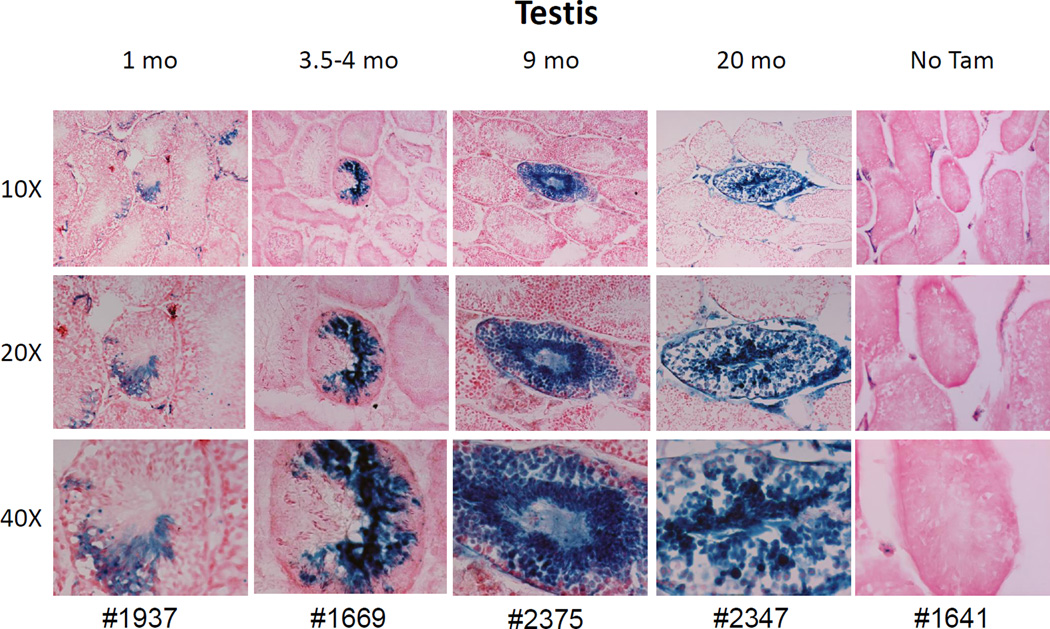
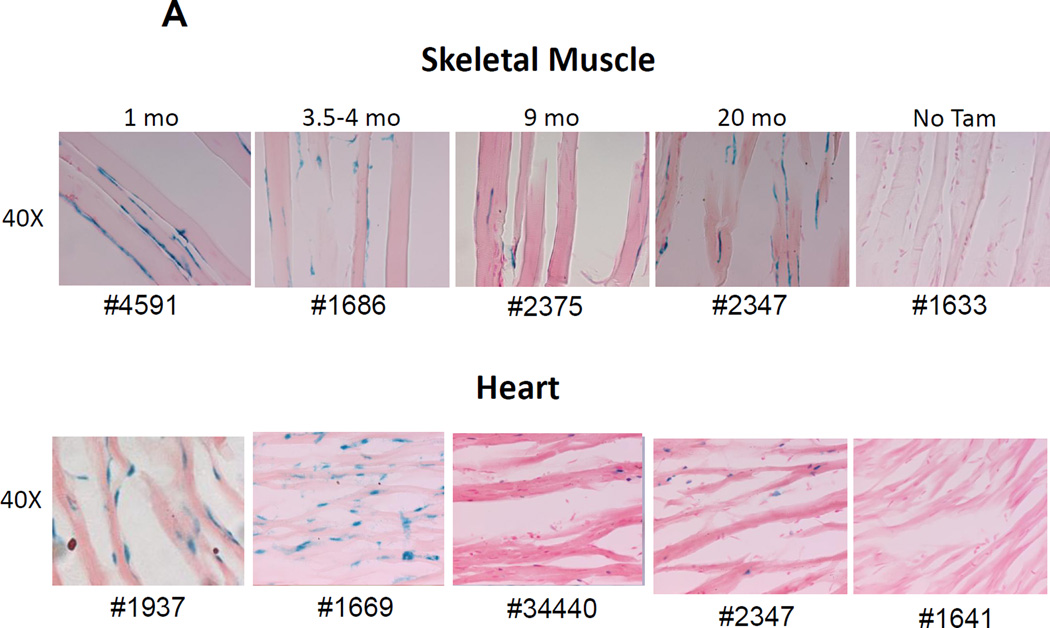
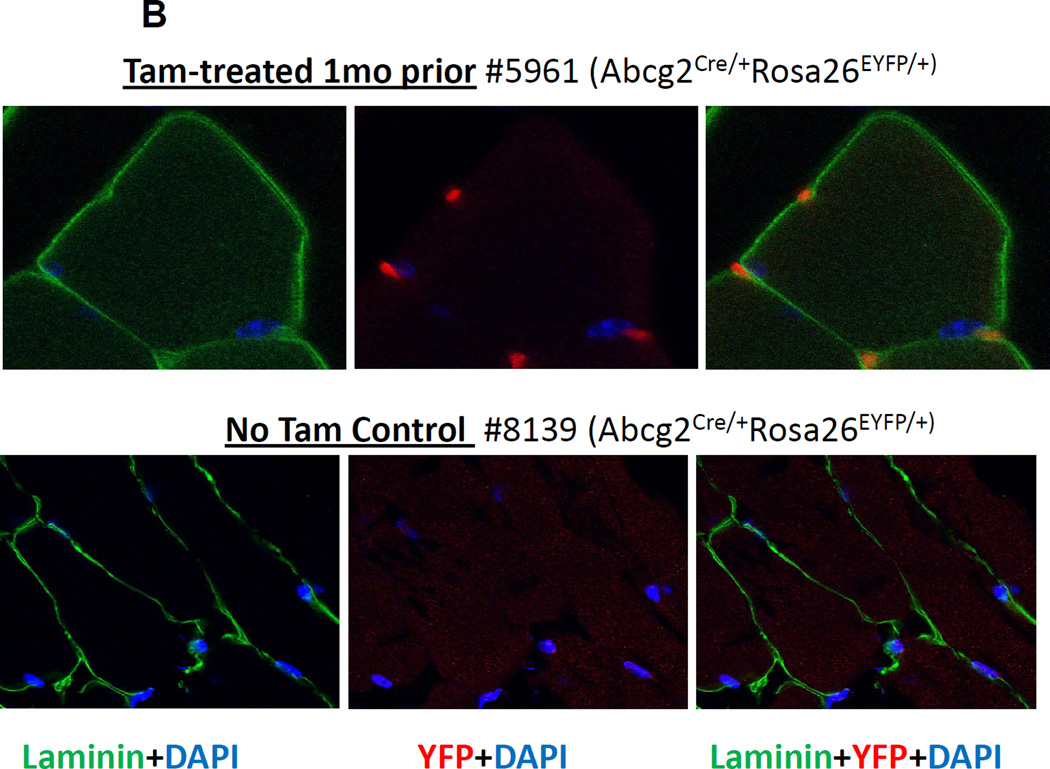
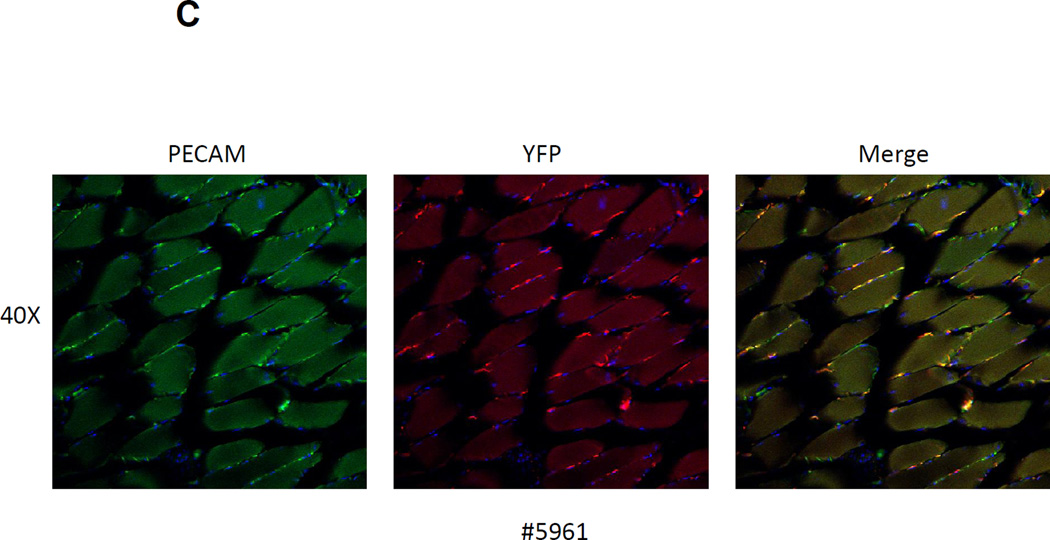
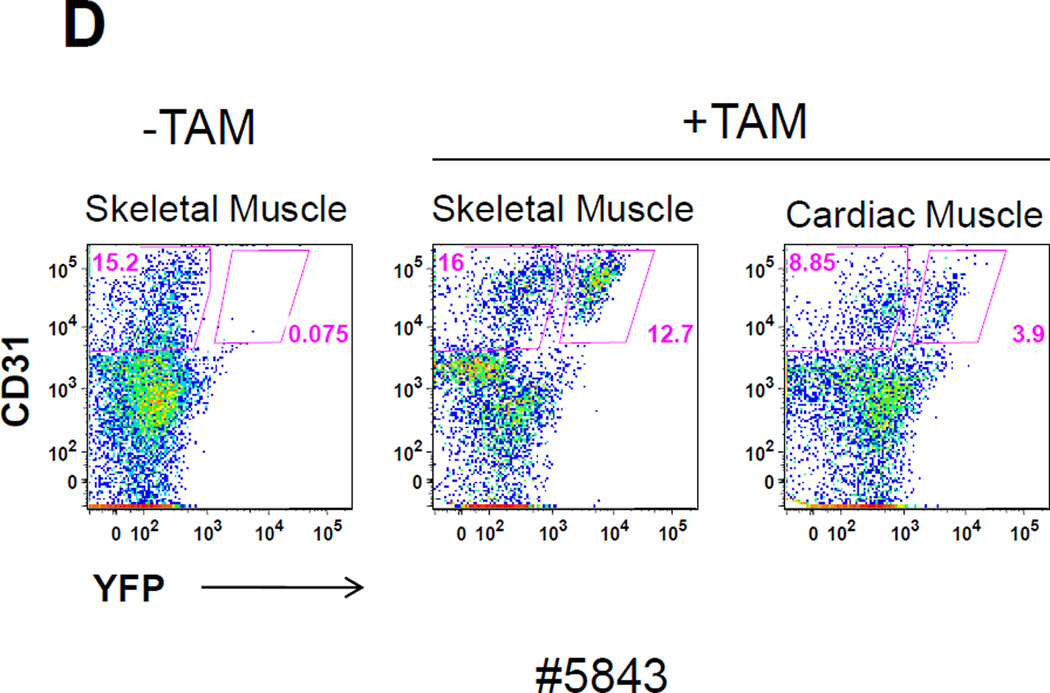
The side population phenotype is associated with the Hoechst dye efflux activity of the Abcg2 transporter and identifies hematopoietic stem cells (HSCs) in the bone marrow. This association suggests the direct use of Abcg2 expression to identify adult stem cells in various other organs. We have generated a lineage tracing mouse model based on an allele that coexpresses both Abcg2 and a CreERT2 expression cassette. By crossing these mice with lox-STOP-lox reporter lines (LacZ or YFP), cells that express Abcg2 and their progeny were identified following treatment with tamoxifen (Tam). In the liver and kidney, in which mature cells express Abcg2, reporter gene expression verified the expected physiologic expression pattern of the recombinant allele. Long-term marking of HSCs was seen in multiple peripheral blood lineages from adult mice, demonstrating that Abcg2(+) bone marrow HSCs contribute to steady-state hematopoiesis. Stem cell tracing patterns were seen in the small intestine and in seminiferous tubules in the testis 20 months after Tam treatment, proving that stem cells from these organs express Abcg2. Interstitial cells from skeletal and cardiac muscle were labeled, and some cells were costained with endothelial markers, raising the possibility that these cells may function in the repair response to muscle injury. Altogether, these studies prove that Abcg2 is a stem cell marker for blood, small intestine, testicular germ cells, and possibly for injured skeletal and/or cardiac muscle and provide a new model for studying stem cell activity that does not require transplant-based assays.


Conflict of interest statement

Disclosure of Potential Conflicts of Interest: none

Figures

Figure 1
Figure 1. Targeted insertion of the ires-CreERT2 expression cassette into the Abcg2 locus
(A) The structure of the wild type allele and the targeted allele are shown. The expression construct was inserted into the 3’UTR as shown. E14, E15 and E16 represent the last three exons of the Abcg2 gene, TAA represents the stop codon of the Abcg2 gene, and pA represents the endogenous polyadenylation signal. The ires-CreERT2 expression cassette was inserted between the TAA and pA sites. NeoR designates the neomycin resistant cassette, TK designated the thymidine kinase gene, and the loxP sites are shown as triangles. The location of the Southern Blot probe, Ssp1 restriction sites, and PCR primer pairs for genotyping is indicated. (B) Southern blot analysis of ES cell clone demonstrating the successful generation of the targeted and floxed Abcg2 allele. (C) Genotyping of homozygous and heterozygous mice by PCR using primer pairs specific to Abcg2CreERT2 allele (P1/P2) and wild type allele (P1/P3). (D) Immunofluorescent confocal microscopy for Abcg2 expression (green), Cre recombinase (red), and nuclear staining (blue) in renal proximal tubular cells from Abcg2CreERT2/CreERT2 mice (left panel), wildtype mice (middle panel), and Abcg2CreERT2/+ mice, right panel.
Figure 2
Figure 2. Reporter gene expression in liver and kidney confirms the expected expression pattern of the Abcg2CreERT2 allele
Abcg2CreERT2/CreERT2 or + RosaLacZ/+ mice were analyzed at various time points ranging from 1 to 20 months after Tam treatment for LacZ expression in the kidney (A) and liver (B). As a negative control, one Abcg2CreERT2/+ RosaLacZ/+ mouse that was not treated with Tam was analyzed at 6 months of age. The magnification is shown on the left and the animal number shown on the bottom of each column corresponds to the genotypes shown in Table 1. LacZ expression in the proximal renal tubules and in hepatocytes corresponds to the known expression pattern of the WT Abcg2 allele.
Figure 3
Figure 3. Expression of the YFP reporter gene in hematopoietic lineages after Tam treatment confirms activity in Abcg2+ hematopoietic stem cells
(A) Flow cytometry analysis of peripheral blood cells from Abcg2CreERT2 Rosa26EYFP mice at 4 and 12 months after Tam labeling (first and second rows). As controls, results from Abcg2CreERT2 Rosa26EYFP mice that were not treated with Tam (3rd row) and a wildtype mouse (last row) are shown. Gating was performed on cells labeled with anti- B220, CD3, Gr1, Mac1, and Ter119 antibodies (columns) representing B cells, T cells, granulocytes, monocytes, and erythroid cells respectively. Pink boxes show the percent of cells that express YFP along the X-axis. (B) Total YFP labeling data for peripheral blood lineages in 26 mice treated with Tam at 1.5 to 21 months prior to analyses. Horizontal bars represent mean marking levels. (C) Representative YFP marking data in gated SP and LSK bone marrow cells from a control WT mouse (top row) and a Abcg2CreERT2 Rosa26EYFP mouse 13 months after Tam (bottom row). Panels show SP gates and LSK gates along with YFP expression analyses. (D) PCR analyses of reporter gene excision efficiency. Detection of the rearranged band is shown in the upper row and detection of a genomic control band from an unrearranged portion of the Abcg2 allele shown in the lower row as a loading control. The first 4 lanes show results from kidney DNA from a Tam treated Abcg2CreERT2 Rosa26EYFP mouse that was diluted at the indicated concentrations with DNA from a wildtype mouse. Lane 5 shows results from a bone marrow sample from a wildtype mouse. Lanes 6 and 7 are from Abcg2CreERT2 Rosa26EYFP mice that were not treated or treated with Tam respectively. Lanes 8 and 9 are from fractionated cells from a WT mouse while lanes 10 and 11 are from fractionated cells from a Tam treated Abcg2CreERT2 Rosa26EYFP mouse. Water negative controls are also shown.
Figure 4
Figure 4. Abcg2 expression marks long term stem cell activity in the small intestine
Mice were treated with Tam and analyzed at the indicated time points for LacZ expression in small intestine sections from the jejunum. One Abcg2CreERT2/+ RosaLacZ/+ mouse, not treated with Tam, was used as negative control at 6 months of age. Labeling of crypt cells and epithelial cells along the villi were seen at all time points and demonstrated classic progeny tracking patterns consistent with stem cell activity.
Figure 5
Figure 5. Abcg2 expression marks germline stem cells in seminiferous tubules from the testis
Mice were treated with Tam and LacZ expression in the testis was examined at various time points. LacZ expression was seen in developing spermatogonia and spermatids in some but not all sections of seminiferous tubules. Significant labeling was noted in tubule cross sections as long as 20 months after Tam administration, demonstrating that male germline stem cells express the Abcg2CreERT2 allele. No marking was noted in control mice that were not treated with Tam.
Figure 6
Figure 6. LacZ expression in perilaminar endothelial cells in skeletal and cardiac muscle
(A) LacZ expression in skeletal muscle from the tibialis anterior and in cardiac muscle was examined at various time points after Tam treatment. Prominent LacZ marking was noted in perilaminar cells at all time points in both skeletal and cardiac muscle. No LacZ staining was detected in myofibers from either skeletal muscle or the heart. (B) Confocal immunofluorescence analysis of the location of YFP-marked cells relative to the basal lamina in skeletal muscle. Sections from a Tam treated Abcg2CreERT2/+ ROSA 26EYFP/+ mouse were stained with an anti-laminin alpha2 chain antibody (green), an anti-YFP antibody (red) and a nuclear stain (blue). Results from no Tam control are shown on the bottom row. It can be seen that the YFP+ cells are located outside of the basal lamina. (C) Immunohistochemical costaining of skeletal muscle sections for YFP+ cells and PECAM, an endothelial cell marker. Confocal microscopy was used to detect antibody staining against YFP (red) and PECAM (green) in muscle sections Abcg2CreERT2 RosaYFP mice were treated with Tam. The panel on the right showed the merged images with yellow cells indicating costaining against both markers. (D) Flow cytometry analysis of single cell suspensions from skeletal muscle and heart. Expression of the CD31 endothelial marker is shown on the Y axis and for the YFP reporter gene on the X axis. The panel on the left shows the results from a mouse that was not treated with Tam. The middle and right panel show skeletal muscle and cardiac cells from a Tam-treated mouse. Note that some but not all endothelial cells are marked two weeks after Tam treatment in skeletal muscle and heart.

Similar articles

Cited by

References

    1. Goodell MA, Brose K, Paradis G, et al. Isolation and functional properties of murine hematopoietic stem cells that are replicating in vivo. J. Exp. Med. 1996;183(4):1797–1806. - PMC - PubMed
    1. Goodell MA, Rosenzweig M, Kim H, et al. Dye efflux studies suggest that hematopoietic stem cells expressing low or undetectable levels of CD34 antigen exist in multiple species. Nat. Med. 1997;3(12):1337–1345. - PubMed
    1. Zhou S, Zong Y, Lu T, et al. Hematopoietic cells from mice that are deficient in both Bcrp1/Abcg2 and Mdr1a/1b develop normally but are sensitized to mitoxantrone. Biotechniques. 2003;35(6):1248–1252. - PubMed
    1. Zhou S, Schuetz JD, Bunting KD, et al. The ABC transporter Bcrp1/ABCG2 is expressed in a wide variety of stem cells and is a molecular determinant of the side-population phenotype. Nat. Med. 2001;7(9):1028–1034. - PubMed
    1. Zhou S, Morris JJ, Barnes Y, et al. Bcrp1 gene expression is required for normal numbers of side population stem cells in mice, and confers relative protection to mitoxantrone in hematopoietic cells in vivo. Proc. Natl. Acad. Sci. U. S. A. 2002;99(19):12339–12344. - PMC - PubMed

Publication types

MeSH terms

Substances