. 2012 Jan 20;287(4):2398-409.
doi: 10.1074/jbc.M111.303503. Epub 2011 Dec 1.

Characterization of heparin-induced glyceraldehyde-3-phosphate dehydrogenase early amyloid-like oligomers and their implication in α-synuclein aggregation

Affiliations

Characterization of heparin-induced glyceraldehyde-3-phosphate dehydrogenase early amyloid-like oligomers and their implication in α-synuclein aggregation

Clarisa M Torres-Bugeau et al. J Biol Chem. .

Abstract

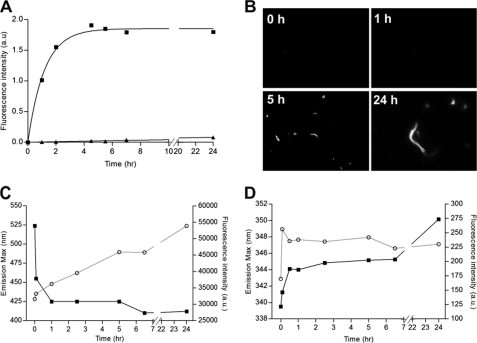
Lewy bodies and Lewy neurites, neuropathological hallmarks of several neurological diseases, are mainly made of filamentous assemblies of α-synuclein. However, other macromolecules including Tau, ubiquitin, glyceraldehyde-3-phosphate dehydrogenase, and glycosaminoglycans are routinely found associated with these amyloid deposits. Glyceraldehyde-3-phosphate dehydrogenase is a glycolytic enzyme that can form fibrillar aggregates in the presence of acidic membranes, but its role in Parkinson disease is still unknown. In this work, the ability of heparin to trigger the amyloid aggregation of this protein at physiological conditions of pH and temperature is demonstrated by infrared and fluorescence spectroscopy, dynamic light scattering, small angle x-ray scattering, circular dichroism, and fluorescence microscopy. Aggregation proceeds through the formation of short rod-like oligomers, which elongates in one dimension. Heparan sulfate was also capable of inducing glyceraldehyde-3-phosphate dehydrogenase aggregation, but chondroitin sulfates A, B, and C together with dextran sulfate had a negligible effect. Aided with molecular docking simulations, a putative binding site on the protein is proposed providing a rational explanation for the structural specificity of heparin and heparan sulfate. Finally, it is demonstrated that in vitro the early oligomers present in the glyceraldehyde-3-phosphate dehydrogenase fibrillation pathway promote α-synuclein aggregation. Taking into account the toxicity of α-synuclein prefibrillar species, the heparin-induced glyceraldehyde-3-phosphate dehydrogenase early oligomers might come in useful as a novel therapeutic strategy in Parkinson disease and other synucleinopathies.


Figures

FIGURE 1.
FIGURE 1.
Effect of heparin on GAPDH fibrillation kinetic study by fluorescence techniques. A, GAPDH aggregation kinetics measured by thioflavin T fluorescence emission. GAPDH alone (▴) or in the presence of 75 μg/ml of heparin (■). B, thioflavin S fluorescence microscopy of GAPDH-heparin interaction at 0, 1, 5, and 24 h. Final protein concentration was 4 mg/ml and magnification 100×. C and D, changes in ANS (C) and Trp (D) fluorescence emission spectra corresponding to the fluorescence intensity (○) at the peak of the emission wavelength (■).
FIGURE 2.
FIGURE 2.
A, heparin dose dependence of GAPDH aggregation: characteristic time τ (open bars) and final amount (closed bars) of ThT fluorescence after 1 h of incubation at 37 °C of GAPDH (0. 16 mg/ml) in the presence of increasing amount of heparin. B, effect of G3P (1 mm) on heparin-induced GAPDH aggregation measured in the presence of different heparin concentrations: 75 μg/ml (*), 150 μg/ml (△), 300 μg/ml (▿), and 600 μg/ml (○). The GAPDH (0.16 mg/ml) aggregation kinetics induced by 75 μg/ml of heparin in the absence of G3P is also represented (■). The line represents the curve fit according to the equation described under “Experimental Procedures.”
FIGURE 3.
FIGURE 3.
Heparin-induced GAPDH conformational changes measured by infrared spectroscopy. A, time evolution of the FTIR spectra of the deconvoluted amide I′ region of GAPDH (4 mg/ml) during oligomer formation at 37 °C and pD 7. The samples were collected after 1.9 mg/ml of heparin addition in different periods of time, every 3 min until the first 60 min were reached. B–E, analysis of GAPDH amide I′ band after the curve fitting procedure (see “Experimental Procedures”) showing the component bands: GAPDH alone (B) and after 5 min (C), 1 h (D), and 24 h (E) of heparin addition.
FIGURE 4.
FIGURE 4.
SAXS curves and data analysis of GAPDH in the presence and in the absence of heparin. A, correspondence between theoretical and experimental SAXS curves: the experimental values (open squares) were obtained by the scattering of 4 mg/ml GAPDH. The theoretical scattering curve (red solid line) calculated from the protein crystallographic structure (1J0X). B, SAXS data from 4 mg/ml GAPDH in solution in the absence (black) and in the presence of heparin at 2 min (red), 60 min (green), and 180 min (blue) of GAPDH-heparin interaction. The respective Guinier plots are displayed in the inset. C, corresponding pair distance distribution function, p(r), calculated from the experimental scattering curve (dashed line) and from the homotetramer crystallographic structure (solid line), calculated by using the GNOM software (37); p(r) functions in the presence of heparin after 2 min (dotted line), 60 min (dashed-dotted line), and 180 min (dashed-double dotted line) from the sample preparation.
FIGURE 5.
FIGURE 5.
DLS analysis and enzymatic activity of GAPDH in the presence and in the absence of heparin. A, DLS measurements of GAPDH in solution along time in the presence of heparin. B, GAPDH (0.16 mg/ml) enzymatic activity in the absence (●) and presence of 75 μg/ml of heparin (○).
FIGURE 6.
FIGURE 6.
Molecular docking simulation results of GAPDH and heparin. A, front and close-up view of the protein-ligand complex. The licorice model is used to represent heparin hexasaccharide, whereas the electrostatic potential is mapped onto the solvent-accessible surface of the GAPDH; a blue color indicates a region of positive potential (+10 kT/e), red indicates a negative potential (−10 kT/e), and white indicates a neutral potential. B, binding mode of heparin to GAPDH with the protein shown in cartoon representation, with heparin and selected amino acids side chain in licorice representation. C, schematic representation of the interaction generated with Ligplot; the reducing end corresponds to the first sugar unit at the bottom of the hexasaccharide.
FIGURE 7.
FIGURE 7.
Effect of different GAGs in GAPDH aggregation. A, kinetics of GAG-induced GAPDH aggregation: ThT fluorescence emission of 0.16 mg/ml of GAPDH (▴) alone and in the presence of different GAGs: 75 μg/ml of heparin (■), HS (●), Dx (□), CS-B (△), and CS-C (△). B, FTIR deconvolved spectra in the amide I′ region of GAPDH alone (solid line) and in the presence CS-A (pointed line), CS-B (dotted line), CS-C (solid line), heparin (dotted-dashed lines), and HS (dashed line) after 60 min of incubation at 37 °C. The line represents the curve fit according to equation described under “Experimental Procedures.”
FIGURE 8.
FIGURE 8.
Influence of GAPDH early oligomers in the AS aggregation kinetics. A, aggregation kinetic of AS in the presence of heparin-induced GAPDH oligomers obtained after 5 min (○), 15 min (▿), 30 min (△), 60 min (□), and 24 h (*) of GAPDH-heparin interaction. Control experiments in the presence of GAPDH alone (+) and heparin (♢) are also depicted. The line represents the curve fit according to equation described under “Experimental Procedures.” B, gel electrophoresis in SDS-PAGE of mixed fibrils. Protein was loaded as follows: lane 1, protein molecular weight marker; lane 2, washed fibrils. The positions of bands of GAPDH and AS are marked by arrows.

References

    1. Tong J., Wong H., Guttman M., Ang L. C., Forno L. S., Shimadzu M., Rajput A. H., Muenter M. D., Kish S. J., Hornykiewicz O., Furukawa Y. (2010) Brain α-synuclein accumulation in multiple system atrophy, Parkinson's disease and progressive supranuclear palsy. A comparative investigation. Brain 133, 172–188 - PubMed
    1. Spillantini M. G., Crowther R. A., Jakes R., Hasegawa M., Goedert M. (1998) α-Synuclein in filamentous inclusions of Lewy bodies from Parkinson's disease and dementia with Lewy bodies. Proc. Natl. Acad. Sci. U.S.A. 95, 6469–6473 - PMC - PubMed
    1. Nussbaum R. L., Ellis C. E. (2003) Alzheimer's disease and Parkinson's disease. N. Engl. J. Med. 348, 1356–1364 - PubMed
    1. Anderson J. P., Walker D. E., Goldstein J. M., de Laat R., Banducci K., Caccavello R. J., Barbour R., Huang J., Kling K., Lee M., Diep L., Keim P. S., Shen X., Chataway T., Schlossmacher M. G., Seubert P., Schenk D., Sinha S., Gai W. P., Chilcote T. J. (2006) Phosphorylation of Ser-129 is the dominant pathological modification of α-synuclein in familial and sporadic Lewy body disease. J. Biol. Chem. 281, 29739–29752 - PubMed
    1. Spillantini M. G., Schmidt M. L., Lee V. M., Trojanowski J. Q., Jakes R., Goedert M. (1997) α-Synuclein in Lewy bodies. Nature 388, 839–840 - PubMed

Publication types

MeSH terms