

Specific absorption rate benefits of including measured electric field interactions in parallel excitation pulse design
- PMID: 22135040
- PMCID: PMC3245373
- DOI: 10.1002/mrm.23004
Specific absorption rate benefits of including measured electric field interactions in parallel excitation pulse design
Abstract
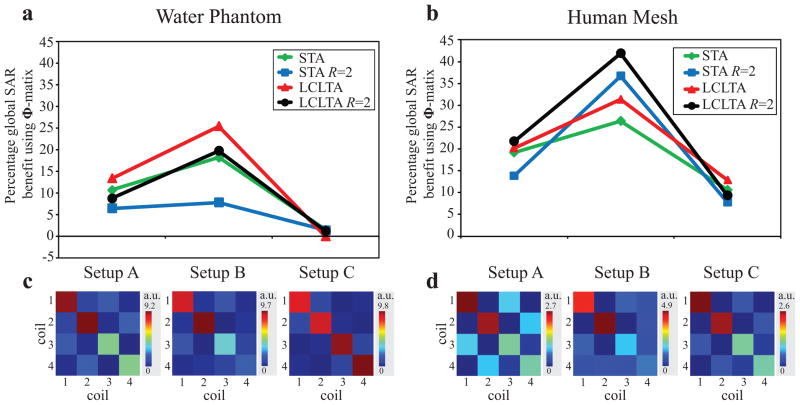
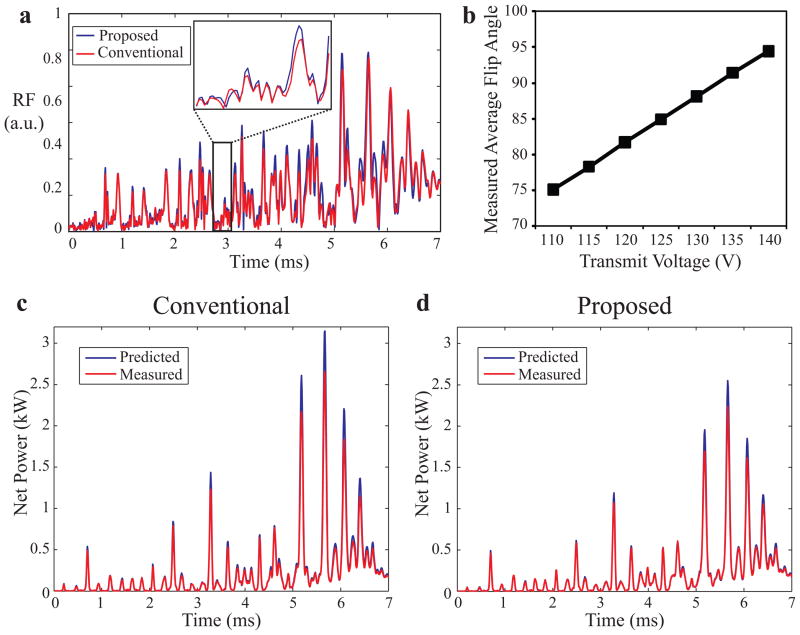
Specific absorption rate management and excitation fidelity are key aspects of radiofrequency pulse design for parallel transmission at ultra-high magnetic field strength. The design of radiofrequency pulses for multiple channels is often based on the solution of regularized least-squares optimization problems for which a regularization term is typically selected to control the integrated or peak pulse waveform amplitude. Unlike single-channel transmission, the specific absorption rate of parallel transmission is significantly influenced by interferences between the electric fields associated with the individual transmission elements, which a conventional regularization term does not take into account. This work explores the effects upon specific absorption rate of incorporating experimentally measurable electric field interactions into parallel transmission pulse design. Results of numerical simulations and phantom experiments show that the global specific absorption rate during parallel transmission decreases when electric field interactions are incorporated into pulse design optimization. The results also show that knowledge of electric field interactions enables robust prediction of the net power delivered to the sample or subject by parallel radiofrequency pulses before they are played out on a scanner.
Copyright © 2011 Wiley-Liss, Inc.
Figures


Similar articles
-
Signal-domain optimization metrics for MPRAGE RF pulse design in parallel transmission at 7 tesla.Magn Reson Med. 2016 Nov;76(5):1431-1442. doi: 10.1002/mrm.26043. Epub 2015 Nov 24. Magn Reson Med. 2016. PMID: 26599411
-
Design of parallel transmission pulses for simultaneous multislice with explicit control for peak power and local specific absorption rate.Magn Reson Med. 2015 May;73(5):1946-53. doi: 10.1002/mrm.25325. Epub 2014 Jun 17. Magn Reson Med. 2015. PMID: 24938991 Free PMC article.
-
A specific absorption rate prediction concept for parallel transmission MR.Magn Reson Med. 2012 Nov;68(5):1664-74. doi: 10.1002/mrm.24138. Epub 2012 Jan 9. Magn Reson Med. 2012. PMID: 22231647
-
Parallel transmission for ultrahigh-field imaging.NMR Biomed. 2016 Sep;29(9):1145-61. doi: 10.1002/nbm.3313. Epub 2015 May 19. NMR Biomed. 2016. PMID: 25989904 Free PMC article. Review.
-
Parallel RF transmission in MRI.NMR Biomed. 2006 May;19(3):393-400. doi: 10.1002/nbm.1049. NMR Biomed. 2006. PMID: 16705630 Review.
Cited by
-
Accelerated calibrationless parallel transmit mapping using joint transmit and receive low-rank tensor completion.Magn Reson Med. 2021 Nov;86(5):2454-2467. doi: 10.1002/mrm.28880. Epub 2021 Jul 1. Magn Reson Med. 2021. PMID: 34196031 Free PMC article.
-
Parallel transmission pulse design with explicit control for the specific absorption rate in the presence of radiofrequency errors.Magn Reson Med. 2016 Jun;75(6):2493-504. doi: 10.1002/mrm.25820. Epub 2015 Jul 3. Magn Reson Med. 2016. PMID: 26147916 Free PMC article.
-
Parallel Excitation in Ultrahigh Field Human MR Imaging and Multi-Channel Transmit System.OMICS J Radiol. 2012 May;1(3):e110. doi: 10.4172/2167-79641000e110. OMICS J Radiol. 2012. PMID: 24069578 Free PMC article. No abstract available.
-
Radiofrequency energy deposition and radiofrequency power requirements in parallel transmission with increasing distance from the coil to the sample.Magn Reson Med. 2016 Jan;75(1):423-32. doi: 10.1002/mrm.25646. Epub 2015 Mar 5. Magn Reson Med. 2016. PMID: 25752250 Free PMC article.
-
Maximum efficiency radiofrequency shimming: Theory and initial application for hip imaging at 7 tesla.Magn Reson Med. 2013 May;69(5):1379-88. doi: 10.1002/mrm.24377. Epub 2012 Jun 19. Magn Reson Med. 2013. PMID: 22714835 Free PMC article.
References
-
- Pauly J, Nishimura D, Macovski A. A k-space analysis of small-tip-angle excitation. J Magn Reson. 1989;81(1):43–56. - PubMed
-
- Rieseberg S, Frahm J, Finsterbusch J. Two-dimensional spatially-selective RF excitation pulses in echo-planar imaging. Magn Reson Med. 2002;47(6):1186–1193. - PubMed
-
- Zhu Y. Parallel excitation with an array of transmit coils. Magn Reson Med. 2004;51(4):775–784. - PubMed
Publication types
MeSH terms
Grants and funding
LinkOut - more resources
Full Text Sources
Other Literature Sources
Medical
