. 2012 Jan;26(1):52-66.
doi: 10.1210/me.2011-1189. Epub 2011 Dec 1.

Suppressed prostate epithelial development with impaired branching morphogenesis in mice lacking stromal fibromuscular androgen receptor

Affiliations

Suppressed prostate epithelial development with impaired branching morphogenesis in mice lacking stromal fibromuscular androgen receptor

Kuo-Pao Lai et al. Mol Endocrinol. 2012 Jan.

Erratum in

Abstract

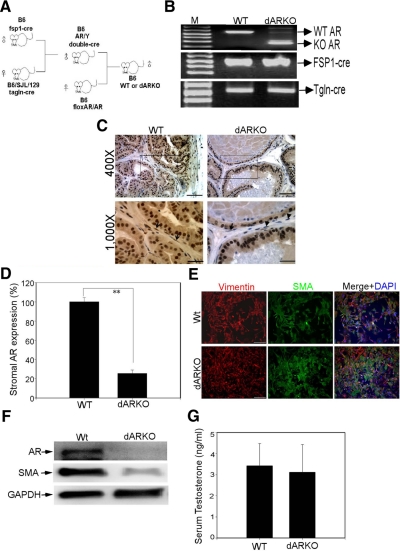
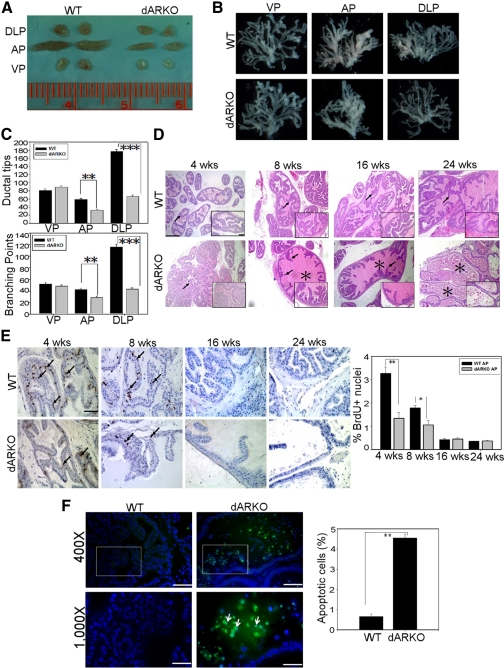
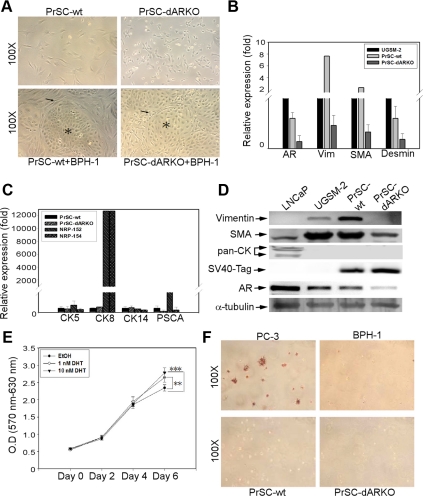
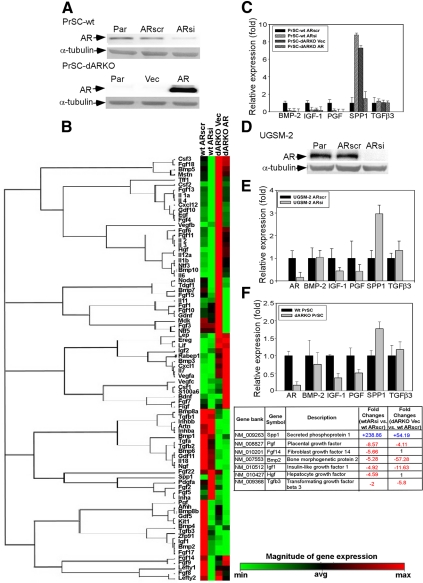
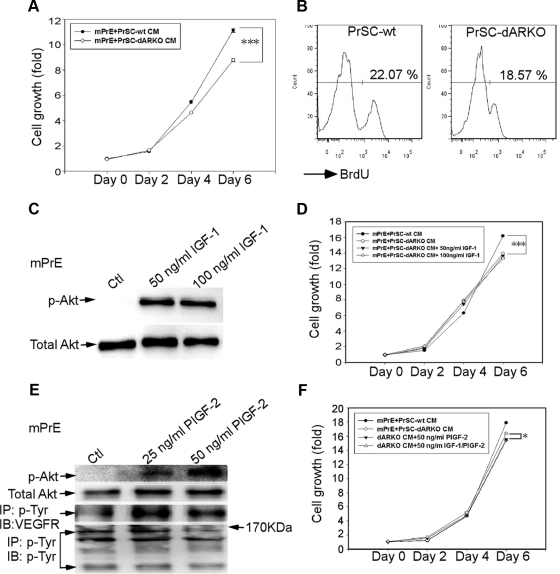
Using the cre-loxP system, we generated a new mouse model [double stromal androgen receptor knockout (dARKO)] with selectively deleted androgen receptor (AR) in both stromal fibroblasts and smooth muscle cells, and found the size of the anterior prostate (AP) lobes was significantly reduced as compared with those from wild-type littermate controls. The reduction in prostate size of the dARKO mouse was accompanied by impaired branching morphogenesis and partial loss of the infolding glandular structure. Further dissection found decreased proliferation and increased apoptosis of the prostate epithelium in the dARKO mouse AP. These phenotype changes were further confirmed with newly established immortalized prostate stromal cells (PrSC) from wild-type and dARKO mice. Mechanistically, IGF-1, placental growth factor, and secreted phosphoprotein-1 controlled by stromal AR were differentially expressed in PrSC-wt and PrSC-ARKO. Moreover, the conditioned media (CM) from PrSC-wt promoted prostate epithelium growth significantly as compared with CM from PrSC-dARKO. Finally, adding IGF-1/placental growth factor recombinant proteins into PrSC-dARKO CM was able to partially rescue epithelium growth. Together, our data concluded that stromal fibromuscular AR could modulate epithelium growth and maintain cellular homeostasis through identified growth factors.


Figures

Fig. 1.
Fig. 1.
Generation and confirmation of dARKO mice. A, Mating strategy for generation of dARKO mice. B, Genotyping of WT and dARKO mice by 2–9/select, FSP1-cre, and Tgln-cre primer sets. Tail genomic DNA was isolated from 3-wk-old WT and dARKO mice, and PCR genotyping was performed to identify WT and truncated AR, FSP1-cre, and Tgln-cre. C, AR IHC staining was used to validate that AR protein was deleted in the AP of 24-wk-old dARKO mice. Arrows indicate the AR-positive staining in stromal cells, and arrowheads represent the AR-negative stromal cells. Eight to 10 fields of each mouse prostate were examined. Scale Bar, 50 μm (×400) and 20 μm (×1000); n = 5–6 for each group. D, The quantification data of stromal AR expression percentage were obtained from AR IHC staining. The data are presented as mean ± sem, n =5–6 for each group (**, P < 0.01 vs. WT littermate controls). E, Primary PrSC cultured from WT and dARKO mouse AP were characterized by IF staining against stromal cell markers, Vimentin (Alexa 594, red) and SMA (Alexa 488, green). 4′,6-diamidino-2-phenylindole (DAPI) staining was used for counterstaining. Scale bar, 200 μm. F, AR and SMA levels were reduced in primary PrSC cultured from dARKO AP by using Western blotting. The glyceraldehyde-3-phosphate dehydrogenase (GAPDH) immunoblotting served as loading control. G, Serum testosterone was monitored by collecting the serum from 8- to 12-wk-old WT and dARKO mice. Similar serum testosterone level was observed in both mouse genotypes. Data are presented as mean ± sem, n =6–7.
Fig. 2.
Fig. 2.
Impaired branching morphogenesis and abnormal histomorphology in AP of dARKO mice. A, Reduced prostate size in AP, but not in VP and DLP in 24-wk-old dARKO mice by gross appearance observation (n = 6 mice per group). B, The representative photograph displayed reduced branching morphogenesis in AP and DLP of dARKO mice at the age of 16 wk (n = 6 mice per group). C, The quantification of ductal tips and branching points was determined, and the results are presented as mean ± sem. (**, P < 0.01; ***, P < 0.001 vs. WT littermates, n =6 mice per group). D, Histological examination of 4-wk-, 8-wk-, 16-wk-, and 24-wk-old WT and dARKO mice. AP tissue sections were subjected to hematoxylin and eosin staining. There is no obvious change in the dARKO mice at 4 wk of age. We started to observe less infolding structure at 8 wk of age with more cuboidal and flattened prostate ducts structure in 24-wk-old dARKO mice. The WT control mice still displayed heightened luminal cells with majority of columnar epithelium and eight to 10 fields of each mouse prostate were analyzed. The infolding glandular epithelium is shown by arrows, and an asterisk marks the lumen of the prostate. Scale bar, 200 μm. Insets are ×400 magnification; scale bar, 50 μm; n = 5–6 for each group. E (left panel), The proliferative index was determined by BrdU incorporation assay. BrdU IHC staining showed reduced proliferative rate of epithelium in dARKO mice AP at 4 and 8 wk of age. Both genotypes of mice showed barely detectable BrdU signals at 16 and 24 wk of age. The BrdU+ epithelial cells are pointed out by arrows. Scale bar, 50 μm. E (right panel), The proliferative index was quantified by Image J system (NIH, Bethesda MD). The data are presented as mean± sem (% of BrdU+ epithelial cells/100 epithelial cells) (*, P < 0.05; **, P < 0.01 vs. WT littermates, n = 6). F (Left panel), terminal deoxynucleotide transferase-mediated dUTP nick end-labeling (TUNEL) assay showed increased apoptosis signals (green) in dARKO mice AP at 24 wk of age. The green fluorescence indicating apoptotic cells is marked by arrows and 4′,6-diamidino-2-phenylindole counterstaining served as nuclei labeling. Scale Bar, 50 μm (×400) and 20 μm (×1000). F (right panel), The quantification data are presented as mean ± sem (% of positive apoptotic cells/100 epithelial cells). (**, P < 0.01 vs. WT littermates, n = 6).
Fig. 3.
Fig. 3.
Decreased height of luminal epithelial cells but no change in stem/progenitor populations in dARKO mice. A, The height of CK8+ luminal cells was decreased in dARKO mouse AP using double-IF staining of CK5 (basal cell marker) and CK8 (luminal cell marker). The basal and luminal epithelial cells were shown as green arrows and red arrowheads, respectively. The 4′,6-diamidino-2-phenylindole (DAPI) staining was used for nuclear counterstaining. Scale bar, 50 μm (×400) and 20 μm (×1000), eight to 10 fields of each mouse prostate were analyzed; n = 5 for each group. B, Prostate stem/progenitor cell populations did not change in dARKO mice prostates by applying flow cytometry to detect surface markers of Sca-1 and CD49f. C, Prostate stem/progenitor cell populations were further determined by costaining with Sca-1 and CD117 (c-Kit) antibodies. The representative images from panels B and C were collected from at least triplicate independent experiments; n = 6–8 mice per group.
Fig. 4.
Fig. 4.
Generation and characterization of immortalized PrSC-wt and PrSC-dARKO. A, Primary prostatic cells were isolated from WT and dARKO mice AP and immortalized by infection with a retrovirus expression vector containing SV40-LTag and then photographed. Upper panel, The appearance of PrSC from WT and dARKO mice is shown. Lower panel, the coculture of BPH-1 cells with PrSC-wt or PrSC-dARKO was conducted. The small clusters of BPH-1 cells pointed -out by asterisks are surrounded by spindle-shaped, elongated PrSC-wt or PrSC-dARKO. The stromal cells are marked by arrows. B, Real-time PCR analysis of stromal cell markers vimentin, SMA, desmin, and AR. The myofibroblast UGSM-2 cells served as positive control. Each bar represents the mean ± sd of at least two independent determinations performed in triplicate. C, Real-time PCR analysis of subtypes of epithelial cell markers CK5, CK8, CK14, and PSCA from NRP-152 cells, NRP-154 cells, PrSC-wt, and PrSC-dARKO. D, Western blot analysis of vimentin, SMA, pan-cytokeratin, SV40-Tag, AR, and α-tubulin in LNCaP cells, UGSM-2 cells, PrSC-wt, and PrSC-dARKO. E, PrSC-wt can respond to androgen stimulation for cell growth. Data are presented from three to four independent experiments (**, P < 0.01; ***, P < 0.001 vs. EtOH). F, PrSC-wt and PrSC-dARKO do not have tumorigenic properties. Anchorage-independent cell growth assay was performed by soft-agar analysis. PC-3 cells, BPH-1 cells, PrSC-wt, and PrSC-dARKO were cultured in soft agar for 3 wk and stained with iodonitrotetrazolium violet (1 mg/ml). Data are presented from three to four independent experiments.
Fig. 5.
Fig. 5.
Identification of potential AR-regulated growth factors from Superarray analysis. A, PrSC-wt ARscr and ARsi knockdown cells were established by lentivirus infection. The cell extracts from PrSC-wt Par, ARscr, and ARsi were subjected to Western blot analysis. The antibodies against AR and α-tubulin were used as shown in the upper panel. PrSC-dARKO were also infected by lentivirus carrying pWPI vector (Vec) or pWPI-mouse AR cDNA (AR). The cell extracts were analyzed by Western blot and probed with AR and α-tubulin antibodies as shown in the lower panel. B, PrSC-wt ARscr, PrSC-wt ARsi, PrSC-dARKO Vec, and PrSC-dARKO AR clones were treated with 10 nm DHT for 24 h followed by RNA harvest and cDNA reverse transcription. The individual cDNA were subjected to real-time PCR analysis using preloaded growth factor Superarray. The data were analyzed by SABioscience website and shown as a heat map diagraph (left panel), and gene signatures were summarized as a table (right panel). C, Real-time PCR was used to validate identified growth factors from Superarray analysis of four cells with differential AR expression. The primer sets specific for BMP-2, IGF-I, PGF, SPP1, and TGFβ3 were used. Each bar represents the mean ± sd of at least two independent determinations performed in triplicate. D, The cell extracts from UGSM-2 Par, ARscr, and ARsi cells were determined by Western blot analysis. E, Real-time PCR analysis was used to quantify growth factor gene transcripts including AR, BMP-2, IGF-I, PGF, SPP1, and TGFβ3 in UGSM-2 ARscr and ARsi cells. F, Real-time PCR analysis in primary culture of WT PrSC and dARKO PrSC. Each bar represents the mean ± sem of at least two independent determinations performed in triplicate.
Fig. 6.
Fig. 6.
PrSC-wt CM provided better growth advantages on mPrE cells than CM from PrSC-dARKO. A, The CM from PrSC-wt or PrSC-dARKO were incubated with mPrE cells and replenished every other day for MTT cell growth assay. The data are presented as mean ± sd from at least three independent experiments (***, P < 0.001; mPrE+PrSC-wt CM vs. mPrE+PrSC-dARKO CM). B, BrdU incorporation assay was used to determine proliferative potentials of mPrE cells incubated with PrSC-wt or PrSC-dARKO CM. The mPrE cells were incubated with CM for 3 d and pulse chased with BrdU 3 h before harvest. The BrdU immunoreactive cells were determined by flow cytometry. The representative data are shown from at last three independent experiments. C, Immunoblotting against p-Akt (at Ser 473) and total-Akt was used to measure the bioactivity of control (Ctl) or recombinant protein IGF-I on mPrE cells. D, mPrE cell growth assay was performed with the incubation of CM from PrSC-wt, PrSC-dARKO, PrSC-dARKO+50 ng/ml IGF-I, or PrSC-dARKO+100 ng/ml IGF-I. The data are presented as mean ± sd from at least three independent experiments (***, P < 0.001; mPrE+PrSC-wt CM vs. mPrE+PrSC-dARKO CM). E, Immunoprecipitation (IP) and immunoblotting (IB) were used to detect p-VEGFR1 expression and p-Akt (at Ser 473) activation in mPrE cells when stimulated with recombinant protein PlGF-2. F, The effects of IGF-I/PlGF-2 on mPrE cell growth were determined by MTT. The data are presented as mean ± sd from at least three independent experiments (*, P < 0.05, mPrE+PrSC-dARKO CM vs. dARKO CM+ 50 ng/ml IGF-I/PlGF-2).

Similar articles

Cited by

References

    1. Cunha GR, Chung LW, Shannon JM, Taguchi O, Fujii H. 1983. Hormone-induced morphogenesis and growth: role of mesenchymal-epithelial interactions. Recent Prog Horm Res 39:559–598 - PubMed
    1. Cunha GR, Chung LW. 1981. Stromal-epithelial interactions–I. Induction of prostatic phenotype in urothelium of testicular feminized (Tfm/y) mice. J Steroid Biochem 14:1317–1324 - PubMed
    1. Cunha GR, Cooke PS, Kurita T. 2004. Role of stromal-epithelial interactions in hormonal responses. Arch Histol Cytol 67:417–434 - PubMed
    1. Cunha GR, Ricke W, Thomson A, Marker PC, Risbridger G, Hayward SW, Wang YZ, Donjacour AA, Kurita T. 2004. Hormonal, cellular, and molecular regulation of normal and neoplastic prostatic development. J Steroid Biochem Mol Biol 92:221–236 - PubMed
    1. Thomson AA. 2008. Mesenchymal mechanisms in prostate organogenesis. Differentiation 76:587–598 - PubMed

Publication types

MeSH terms