Review
. 2012 Nov;33(10):1836-44.
doi: 10.3174/ajnr.A2782. Epub 2011 Dec 1.

Imaging approaches for dementia

Affiliations
Review

Imaging approaches for dementia

A D Murray. AJNR Am J Neuroradiol. 2012 Nov.

Abstract

Brain imaging has progressed from exclusion of rare treatable mass lesions to a specific antemortem diagnosis. MR imaging-derived hippocampal atrophy and WMH are regarded as imaging biomarkers of AD and CVD respectively. Abnormal FP-CIT SPECT or cardiac iodobenzamide SPECT is a useful supportive imaging feature in the diagnosis of DLB. Frontal and/or anterior temporal atrophy and anterior defects on molecular imaging with FDG-PET or perfusion SPECT are characteristic of FTDs. Whole-body FDG-PET may be helpful in patients with rapidly progressing "autoimmune dementias," and FLAIR and DWI are indicated in suspected CJD. A major role of imaging is in the development of new drugs and less costly biomarkers.


Figures

Fig 1.
Fig 1.
Automated voxel-based hippocampal volumetry by using FreeSurfer, showing left and right hippocampi.
Fig 2.
Fig 2.
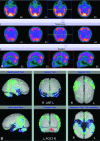
A, Blood flow (technetium TC99m hexamethylpropyleneamine oxime) SPECT showing reduced perfusion in the temporoparietal regions. B, Results of a comparison of A with a normal control data base highlights the temporoparietal deficits, in which perfusion is reduced between 2 and 3 SDs (blue and green regions).
Fig 3.
Fig 3.
18FDG-PET superimposed on T1-weighted MR imaging shows reduced FDG uptake in the medial temporal lobe (arrows) and corresponding atrophy (arrowheads) in early AD.
Fig 4.
Fig 4.
T2 axial MR imaging in a 68-year-old man with extensive WMH, typical of ischemic change.
Fig 5.
Fig 5.
Enlarged perivascular spaces (A) on T2 axial MR imaging (arrow) and T1 sagittal MR imaging (B, arrow).
Fig 6.
Fig 6.
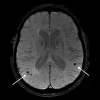
Lobar microhemorrhages on T2* gradient-recalled echo MR imaging (arrows). Images courtesy of Meike Vernooij, MD, Erasmus MC, Rotterdam, the Netherlands.
Fig 7.
Fig 7.
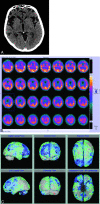
Axial CT image (A) in a patient with behavioral variant frontotemporal dementia shows a marked frontal atrophy, and axial perfusion SPECT images (B) show reduced anterior perfusion, which is more obviously appreciated in comparison with the normal control data base (C, as in Fig 2).
Fig 8.
Fig 8.
FP-CIT images in a healthy patient (A) and a patient with parkinsonian disorder, in this case DLB (B).

References

    1. Reitz C, Brayne C, Mayeux R. Epidemiology of Alzheimer disease. Nat Rev Neurol 2011;7:137–52 - PMC - PubMed
    1. Matthews FE, Brayne C, Lowe J, et al. . Epidemiological pathology of dementia: attributable-risks at death in the medical research council cognitive function and ageing study. PLoS Med 2009;6:e1000180. - PMC - PubMed
    1. Knopman DS, DeKosky ST, Cummings JL, et al. . Practice parameter: diagnosis of dementia (an evidence-based review. Report of the quality standards subcommittee of the American Academy of Neurology). Neurology 2001;56:1143–53 - PubMed
    1. Matsuda H. Role of neuroimaging in Alzheimer's disease, with emphasis on brain perfusion SPECT. J Nucl Med 2007;48:1289–300 - PubMed
    1. Jack CR, Jr, Bernstein MA, Borowski BJ, et al. . Update on the magnetic resonance imaging core of the Alzheimer's disease neuroimaging initiative. Alzheimers Dement 2010;6:212–20 - PMC - PubMed

Publication types

Substances