

The genetic consequences of spatially varying selection in the panmictic American eel (Anguilla rostrata)
- PMID: 22135355
- PMCID: PMC3276646
- DOI: 10.1534/genetics.111.134825
The genetic consequences of spatially varying selection in the panmictic American eel (Anguilla rostrata)
Abstract
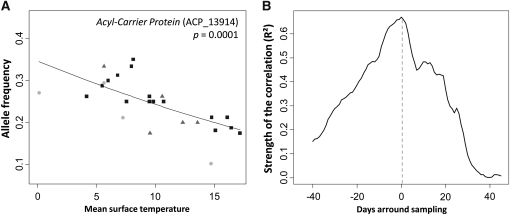
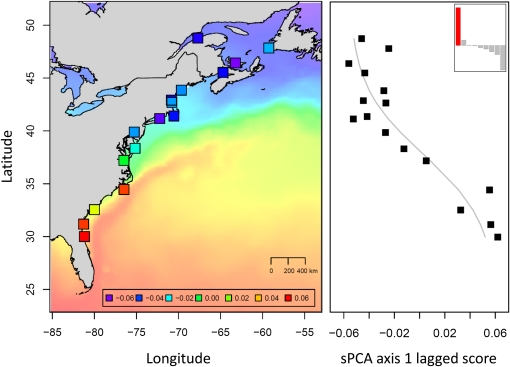
Our understanding of the genetic basis of local adaptation has recently benefited from the increased power to identify functional variants associated with environmental variables at the genome scale. However, it often remains challenging to determine whether locally adaptive alleles are actively maintained at intermediate frequencies by spatially varying selection. Here, we evaluate the extent to which this particular type of balancing selection explains the retention of adaptive genetic variation in the extreme situation of perfect panmixia, using the American eel (Anguilla rostrata) as a model. We first conducted a genome scan between two samples from opposite ends of a latitudinal environmental gradient using 454 sequencing of individually tagged cDNA libraries. Candidate SNPs were then genotyped in 992 individuals from 16 sampling sites at different life stages of the same cohort (including larvae from the Sargasso Sea, glass eels, and 1-year-old individuals) as well as in glass eels of the following cohort. Evidence for spatially varying selection was found at 13 loci showing correlations between allele frequencies and environmental variables across the entire species range. Simulations under a multiple-niche Levene's model using estimated relative fitness values among genotypes rarely predicted a stable polymorphic equilibrium at these loci. Our results suggest that some genetic-by-environment interactions detected in our study arise during the progress toward fixation of a globally advantageous allele with spatially variable effects on fitness.
Figures
Similar articles
-
RAD-Seq Reveals Patterns of Additive Polygenic Variation Caused by Spatially-Varying Selection in the American Eel (Anguilla rostrata).Genome Biol Evol. 2017 Nov 1;9(11):2974-2986. doi: 10.1093/gbe/evx226. Genome Biol Evol. 2017. PMID: 29136139 Free PMC article.
-
Genome-wide single-generation signatures of local selection in the panmictic European eel.Mol Ecol. 2014 May;23(10):2514-28. doi: 10.1111/mec.12753. Mol Ecol. 2014. PMID: 24750353
-
In absence of local adaptation, plasticity and spatially varying selection rule: a view from genomic reaction norms in a panmictic species (Anguilla rostrata).BMC Genomics. 2014 May 27;15:403. doi: 10.1186/1471-2164-15-403. BMC Genomics. 2014. PMID: 24884429 Free PMC article.
-
A century of research on the larval distributions of the Atlantic eels: a re-examination of the data.Biol Rev Camb Philos Soc. 2015 Nov;90(4):1035-64. doi: 10.1111/brv.12144. Epub 2014 Oct 8. Biol Rev Camb Philos Soc. 2015. PMID: 25291986 Review.
-
The search for loci under selection: trends, biases and progress.Mol Ecol. 2018 Mar;27(6):1342-1356. doi: 10.1111/mec.14549. Epub 2018 Mar 30. Mol Ecol. 2018. PMID: 29524276 Review.
Cited by
-
Investigating the genetics of Bti resistance using mRNA tag sequencing: application on laboratory strains and natural populations of the dengue vector Aedes aegypti.Evol Appl. 2013 Nov;6(7):1012-27. doi: 10.1111/eva.12082. Epub 2013 Aug 31. Evol Appl. 2013. PMID: 24187584 Free PMC article.
-
RAD-Seq Reveals Patterns of Additive Polygenic Variation Caused by Spatially-Varying Selection in the American Eel (Anguilla rostrata).Genome Biol Evol. 2017 Nov 1;9(11):2974-2986. doi: 10.1093/gbe/evx226. Genome Biol Evol. 2017. PMID: 29136139 Free PMC article.
-
Panmixia in the American eel extends to its tropical range of distribution: Biological implications and policymaking challenges.Evol Appl. 2023 Nov 17;16(12):1872-1888. doi: 10.1111/eva.13599. eCollection 2023 Dec. Evol Appl. 2023. PMID: 38143897 Free PMC article.
-
Range-wide parallel climate-associated genomic clines in Atlantic salmon.R Soc Open Sci. 2017 Nov 15;4(11):171394. doi: 10.1098/rsos.171394. eCollection 2017 Nov. R Soc Open Sci. 2017. PMID: 29291123 Free PMC article.
-
Demographic History, Adaptation, and NRAP Convergent Evolution at Amino Acid Residue 100 in the World Northernmost Cattle from Siberia.Mol Biol Evol. 2021 Jul 29;38(8):3093-3110. doi: 10.1093/molbev/msab078. Mol Biol Evol. 2021. PMID: 33784744 Free PMC article.
References
-
- Altshuler D., Pollara V., Cowles C., Van Etten W., Baldwin J., et al. , 2000. An SNP map of the human genome generated by reduced representation shotgun sequencing. Nature 407: 513–516 - PubMed
-
- Barrett J. C., Fry B., Maller J., Daly M. J., 2005. Haploview: analysis and visualization of LD and haplotype maps. Bioinformatics 21: 263–265 - PubMed
-
- Beaumont M. A., Nichols R. A., 1996. Evaluating loci for use in the genetic analysis of population structure. Proc. R. Soc. Lond. B Biol. Sci. 263: 1619–1626
Publication types
MeSH terms
LinkOut - more resources
Full Text Sources
