The genetic basis of heterosis: multiparental quantitative trait loci mapping reveals contrasted levels of apparent overdominance among traits of agronomical interest in maize (Zea mays L.)
- PMID: 22135356
- PMCID: PMC3276634
- DOI: 10.1534/genetics.111.133447
The genetic basis of heterosis: multiparental quantitative trait loci mapping reveals contrasted levels of apparent overdominance among traits of agronomical interest in maize (Zea mays L.)
Abstract
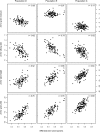
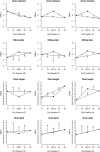
Understanding the genetic bases underlying heterosis is a major issue in maize (Zea mays L.). We extended the North Carolina design III (NCIII) by using three populations of recombinant inbred lines derived from three parental lines belonging to different heterotic pools, crossed with each parental line to obtain nine families of hybrids. A total of 1253 hybrids were evaluated for grain moisture, silking date, plant height, and grain yield. Quantitative trait loci (QTL) mapping was carried out on the six families obtained from crosses to parental lines following the "classical" NCIII method and with a multiparental connected model on the global design, adding the three families obtained from crosses to the nonparental line. Results of the QTL detection highlighted that most of the QTL detected for grain yield displayed apparent overdominance effects and limited differences between heterozygous genotypes, whereas for grain moisture predominance of additive effects was observed. For plant height and silking date results were intermediate. Except for grain yield, most of the QTL identified showed significant additive-by-additive epistatic interactions. High correlation observed between heterosis and the heterozygosity of hybrids at markers confirms the complex genetic basis and the role of dominance in heterosis. An important proportion of QTL detected were located close to the centromeres. We hypothesized that the lower recombination in these regions favors the detection of (i) linked QTL in repulsion phase, leading to apparent overdominance for heterotic traits and (ii) linked QTL in coupling phase, reinforcing apparent additive effects of linked QTL for the other traits.
Figures


Similar articles
-
Genetic dissection of yield-related traits and mid-parent heterosis for those traits in maize (Zea mays L.).BMC Plant Biol. 2019 Sep 9;19(1):392. doi: 10.1186/s12870-019-2009-2. BMC Plant Biol. 2019. PMID: 31500559 Free PMC article.
-
High congruency of QTL positions for heterosis of grain yield in three crosses of maize.Theor Appl Genet. 2010 Jan;120(2):321-32. doi: 10.1007/s00122-009-1209-9. Epub 2009 Nov 13. Theor Appl Genet. 2010. PMID: 19911156
-
Genetic basis of grain yield heterosis in an "immortalized F₂" maize population.Theor Appl Genet. 2014 Oct;127(10):2149-58. doi: 10.1007/s00122-014-2368-x. Epub 2014 Aug 8. Theor Appl Genet. 2014. PMID: 25104328
-
Molecular dissection of heterosis in cereal roots and their rhizosphere.Theor Appl Genet. 2023 Jul 20;136(8):173. doi: 10.1007/s00122-023-04419-6. Theor Appl Genet. 2023. PMID: 37474870 Free PMC article. Review.
-
Mapping QTLs regulating morpho-physiological traits and yield: case studies, shortcomings and perspectives in drought-stressed maize.Ann Bot. 2002 Jun;89 Spec No(7):941-63. doi: 10.1093/aob/mcf134. Ann Bot. 2002. PMID: 12102519 Free PMC article. Review.
Cited by
-
Genetic dissection of heterotic loci associated with plant weight by Graded pool-seq in heading Chinese cabbage (Brassica rapa).Planta. 2022 May 16;255(6):126. doi: 10.1007/s00425-022-03880-9. Planta. 2022. PMID: 35575830
-
Transcriptome Reveals Allele Contribution to Heterosis in Maize.Front Plant Sci. 2021 Sep 23;12:739072. doi: 10.3389/fpls.2021.739072. eCollection 2021. Front Plant Sci. 2021. PMID: 34630491 Free PMC article.
-
Identification of Heterotic Loci with Desirable Allelic Interaction to Increase Yield in Rice.Rice (N Y). 2021 Nov 26;14(1):97. doi: 10.1186/s12284-021-00539-z. Rice (N Y). 2021. PMID: 34826005 Free PMC article.
-
Genetic dissection of main and epistatic effects of QTL based on augmented triple test cross design.PLoS One. 2017 Dec 14;12(12):e0189054. doi: 10.1371/journal.pone.0189054. eCollection 2017. PLoS One. 2017. PMID: 29240818 Free PMC article.
-
Linking transcriptomic and genomic variation to growth in brook charr hybrids (Salvelinus fontinalis, Mitchill).Heredity (Edinb). 2013 May;110(5):492-500. doi: 10.1038/hdy.2012.117. Epub 2013 Jan 16. Heredity (Edinb). 2013. PMID: 23321707 Free PMC article.
References
-
- Ajmone Marsan P., Gorni C., Chittò A., Redaelli R., van Vijk R., et al. , 2001. Identification of QTLs for grain yield and grain-related traits of maize (Zea mays L.) using an AFLP map, different testers, and cofactor analysis. Theor. Appl. Genet. 102: 230–243
-
- Barbosa A. M. M., Geraldi I. O., Benchimol L. L., Garcia A. A. F., Souza C. L., et al. , 2003. Relationship of intra-and interpopulation tropical maize single cross hybrid performance and genetic distances computed from AFLP and SSR markers. Euphytica 130: 87–99
-
- Bernardo R., 1992. Relationship between single-cross performance and molecular marker heterozygosity. Theor. Appl. Genet. 83: 628–634 - PubMed
-
- Blanc G., Charcosset A., Mangin B., Gallais A., Moreau L., 2006. Connected populations for detecting quantitative trait loci and testing for epistasis: an application in maize. Theor. Appl. Genet. 113: 206–224 - PubMed
-
- Bruce A. B., 1910. The Mendelian theory of heredity and the augmentation of vigor. Science 32: 627–628 - PubMed
MeSH terms
LinkOut - more resources
Full Text Sources

