

Meta-analysis for linear and nonlinear dose-response relations: examples, an evaluation of approximations, and software
- PMID: 22135359
- PMCID: PMC3244608
- DOI: 10.1093/aje/kwr265
Meta-analysis for linear and nonlinear dose-response relations: examples, an evaluation of approximations, and software
Abstract
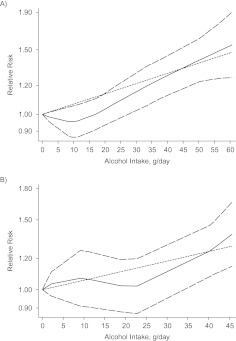
Two methods for point and interval estimation of relative risk for log-linear exposure-response relations in meta-analyses of published ordinal categorical exposure-response data have been proposed. The authors compared the results of a meta-analysis of published data using each of the 2 methods with the results that would be obtained if the primary data were available and investigated the circumstances under which the approximations required for valid use of each meta-analytic method break down. They then extended the methods to handle nonlinear exposure-response relations. In the present article, methods are illustrated using studies of the relation between alcohol consumption and colorectal and lung cancer risks from the ongoing Pooling Project of Prospective Studies of Diet and Cancer. In these examples, the differences between the results of a meta-analysis of summarized published data and the pooled analysis of the individual original data were small. However, incorrectly assuming no correlation between relative risk estimates for exposure categories from the same study gave biased confidence intervals for the trend and biased P values for the tests for nonlinearity and between-study heterogeneity when there was strong confounding by other model covariates. The authors illustrate the use of 2 publicly available user-friendly programs (Stata and SAS) to implement meta-analysis for dose-response data.
Figures
References
-
- Berlin JA, Longnecker MP, Greenland S. Meta-analysis of epidemiologic dose-response data. Epidemiology. 1993;4(3):218–228. - PubMed
-
- Greenland S, Longnecker MP. Methods for trend estimation from summarized dose-response data, with applications to meta-analysis. Am J Epidemiol. 1992;135(11):1301–1309. - PubMed
-
- Hamling J, Lee P, Weitkunat R, et al. Facilitating meta-analyses by deriving relative effect and precision estimates for alternative comparisons from a set of estimates presented by exposure level or disease category. Stat Med. 2008;27(7):954–970. - PubMed
-
- Easton DF, Peto J, Babiker AG. Floating absolute risk: an alternative to relative risk in survival and case-control analysis avoiding an arbitrary reference group. Stat Med. 1991;10(7):1025–1035. - PubMed
-
- Orsini N. From floated to conventional confidence intervals for the relative risks based on published dose-response data. Comput Methods Programs Biomed. 2010;98(1):90–93. - PubMed
