

Hybrid incompatibility in Arabidopsis is determined by a multiple-locus genetic network
- PMID: 22135429
- PMCID: PMC3271768
- DOI: 10.1104/pp.111.188706
Hybrid incompatibility in Arabidopsis is determined by a multiple-locus genetic network
Abstract
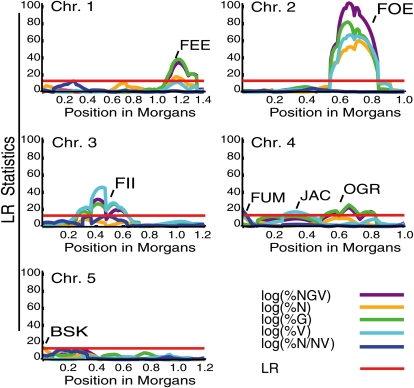
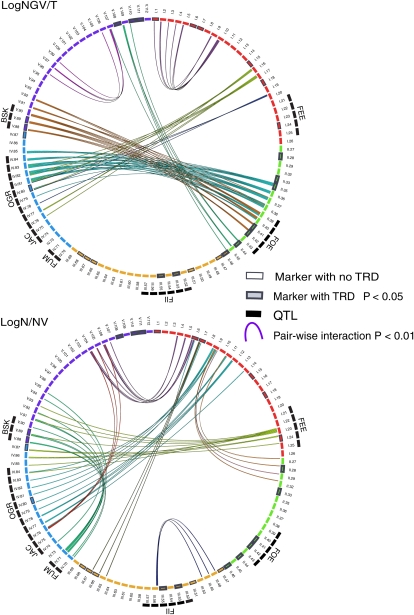
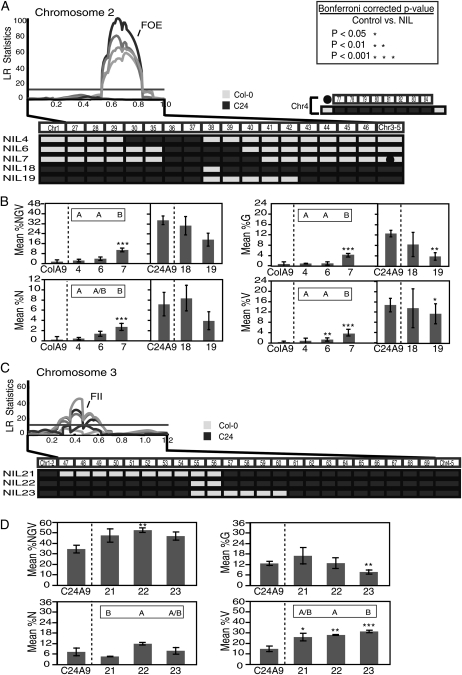
The cross between Arabidopsis thaliana and the closely related species Arabidopsis arenosa results in postzygotic hybrid incompatibility, manifested as seed death. Ecotypes of A. thaliana were tested for their ability to produce live seed when crossed to A. arenosa. The identified genetic variation was used to map quantitative trait loci (QTLs) encoded by the A. thaliana genome that affect the frequency of postzygotic lethality and the phenotypes of surviving seeds. Seven QTLs affecting the A. thaliana component of this hybrid incompatibility were identified by crossing a Columbia × C24 recombinant inbred line population to diploid A. arenosa pollen donors. Additional epistatic loci were identified based on their pairwise interaction with one or several of these QTLs. Epistatic interactions were detected for all seven QTLs. The two largest additive QTLs were subjected to fine-mapping, indicating the action of at least two genes in each. The topology of this network reveals a large set of minor-effect loci from the maternal genome controlling hybrid growth and viability at different developmental stages. Our study establishes a framework that will enable the identification and characterization of genes and pathways in A. thaliana responsible for hybrid lethality in the A. thaliana × A. arenosa interspecific cross.
Figures


Similar articles
-
An Epigenetic Role for Disrupted Paternal Gene Expression in Postzygotic Seed Abortion in Arabidopsis Interspecific Hybrids.Mol Plant. 2015 Dec 7;8(12):1766-75. doi: 10.1016/j.molp.2015.09.009. Epub 2015 Sep 25. Mol Plant. 2015. PMID: 26409189
-
Perturbation of parentally biased gene expression during interspecific hybridization.PLoS One. 2015 Feb 26;10(2):e0117293. doi: 10.1371/journal.pone.0117293. eCollection 2015. PLoS One. 2015. PMID: 25719202 Free PMC article.
-
Endosperm-based hybridization barriers explain the pattern of gene flow between Arabidopsis lyrata and Arabidopsis arenosa in Central Europe.Proc Natl Acad Sci U S A. 2017 Feb 7;114(6):E1027-E1035. doi: 10.1073/pnas.1615123114. Epub 2017 Jan 23. Proc Natl Acad Sci U S A. 2017. PMID: 28115687 Free PMC article.
-
Genetic mechanisms of postzygotic reproductive isolation: An epistatic network in rice.Breed Sci. 2013 Dec;63(4):359-66. doi: 10.1270/jsbbs.63.359. Epub 2013 Dec 1. Breed Sci. 2013. PMID: 24399907 Free PMC article. Review.
-
Understanding and overcoming hybrid lethality in seed and seedling stages as barriers to hybridization and gene flow.Front Plant Sci. 2023 Jul 5;14:1219417. doi: 10.3389/fpls.2023.1219417. eCollection 2023. Front Plant Sci. 2023. PMID: 37476165 Free PMC article. Review.
Cited by
-
Evolution and Molecular Control of Hybrid Incompatibility in Plants.Front Plant Sci. 2016 Aug 11;7:1208. doi: 10.3389/fpls.2016.01208. eCollection 2016. Front Plant Sci. 2016. PMID: 27563306 Free PMC article. Review.
-
The timetable for allopolyploidy in flowering plants.Ann Bot. 2013 Nov;112(7):1201-8. doi: 10.1093/aob/mct194. Epub 2013 Aug 21. Ann Bot. 2013. PMID: 23965616 Free PMC article. Review.
-
Exploiting natural variation of secondary metabolism identifies a gene controlling the glycosylation diversity of dihydroxybenzoic acids in Arabidopsis thaliana.Genetics. 2014 Nov;198(3):1267-76. doi: 10.1534/genetics.114.168690. Epub 2014 Aug 29. Genetics. 2014. PMID: 25173843 Free PMC article.
-
Arabidopsis halleri: a perennial model system for studying population differentiation and local adaptation.AoB Plants. 2019 Nov 27;11(6):plz076. doi: 10.1093/aobpla/plz076. eCollection 2019 Dec. AoB Plants. 2019. PMID: 31832127 Free PMC article. Review.
-
Early disruption of maternal-zygotic interaction and activation of defense-like responses in Arabidopsis interspecific crosses.Plant Cell. 2013 Jun;25(6):2037-55. doi: 10.1105/tpc.112.108258. Epub 2013 Jun 28. Plant Cell. 2013. PMID: 23898028 Free PMC article.
References
-
- Basten C, Weir B, Zeng Z. (1994) Zmap-a QTL cartographer. Proceedings of the 5th World Congress on Genetics Applied to Livestock Production: Computing Strategies and Software, Vol 22. pp 65–66. Published by the Organizing Committee, 5th World Congress on Genetics Applied to Livestock Production, Guelph, Ontario, Canada
-
- Bikard D, Patel D, Le Metté C, Giorgi V, Camilleri C, Bennett MJ, Loudet O. (2009) Divergent evolution of duplicate genes leads to genetic incompatibilities within A. thaliana. Science 323: 623–626 - PubMed
-
- Bomblies K. (2010) Doomed lovers: mechanisms of isolation and incompatibility in plants. Annu Rev Plant Biol 61: 109–124 - PubMed
-
- Bomblies K, Weigel D. (2007) Hybrid necrosis: autoimmunity as a potential gene-flow barrier in plant species. Nat Rev Genet 8: 382–393 - PubMed
Publication types
MeSH terms
Grants and funding
LinkOut - more resources
Full Text Sources
