. 2012 Feb;158(2):824-34.
doi: 10.1104/pp.111.185033. Epub 2011 Dec 1.

Genetic architecture of maize kernel composition in the nested association mapping and inbred association panels

Affiliations

Genetic architecture of maize kernel composition in the nested association mapping and inbred association panels

Jason P Cook et al. Plant Physiol. 2012 Feb.

Abstract

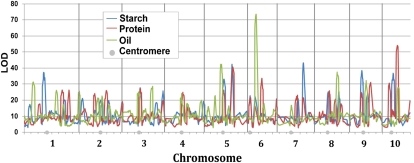
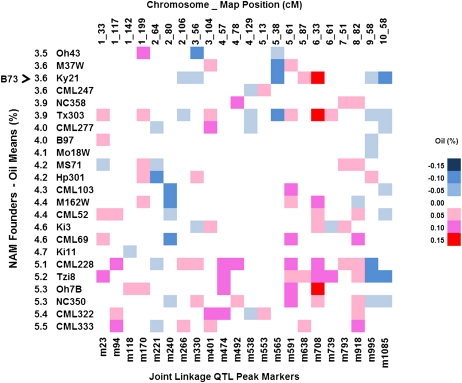
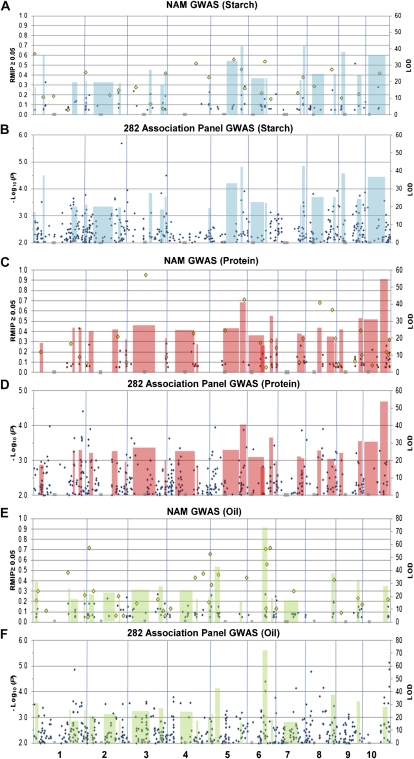
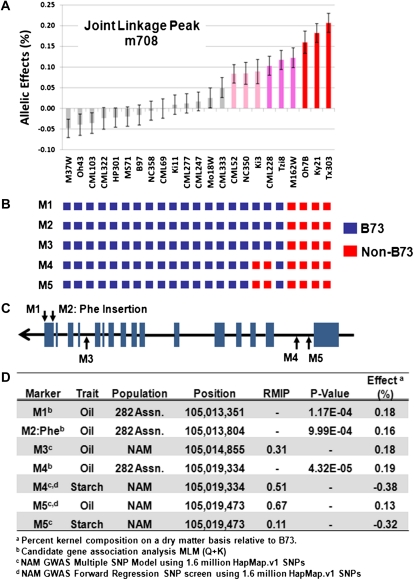
The maize (Zea mays) kernel plays a critical role in feeding humans and livestock around the world and in a wide array of industrial applications. An understanding of the regulation of kernel starch, protein, and oil is needed in order to manipulate composition to meet future needs. We conducted joint-linkage quantitative trait locus mapping and genome-wide association studies (GWAS) for kernel starch, protein, and oil in the maize nested association mapping population, composed of 25 recombinant inbred line families derived from diverse inbred lines. Joint-linkage mapping revealed that the genetic architecture of kernel composition traits is controlled by 21-26 quantitative trait loci. Numerous GWAS associations were detected, including several oil and starch associations in acyl-CoA:diacylglycerol acyltransferase1-2, a gene that regulates oil composition and quantity. Results from nested association mapping were verified in a 282 inbred association panel using both GWAS and candidate gene association approaches. We identified many beneficial alleles that will be useful for improving kernel starch, protein, and oil content.


Figures

Figure 1.
Figure 1.
Joint-linkage QTL analysis for kernel starch, protein, and oil content in NAM. Gray circles, Location of centromeres; vertical lines, chromosome boundaries; horizontal units, centiMorgans (cM); vertical units, log of odds (LOD; see also Supplemental Tables S2–S4).
Figure 2.
Figure 2.
Heat map displaying additive allelic effects for oil content QTLs for the 23 NAM founders relative to B73. The top horizontal axis lists the chromosome and genetic map position for each QTL peak, and the bottom axis shows the NAM map SNP selected by stepwise regression. The vertical axis displays the 23 inbred NAM founder lines sorted in increasing percent oil content on a dry matter basis. Allelic effects are color coded based on 0.05% increments.
Figure 3.
Figure 3.
Starch, protein, and oil GWAS in NAM and the 282 inbred AP compared with the NAM joint-linkage mapping analysis. The regions shaded blue (starch), red (protein), and green (oil) depict NAM joint-linkage QTL support intervals, with their height indicating log of the odds (LOD) score. Gray boxes along the horizontal axis, Centromere positions. A, C, and E, NAM, black diamonds indicate position and magnitude of associations detected by the subsampling method (RMIP ≥ 0.05; Supplemental Tables S12–S14), and yellow diamonds show the position and magnitude of associations selected by both the 100 subsample and single forward regression methods (RMIP; Supplemental Tables S9–S11). B, D, and F, 282 Inbred AP, black diamonds show the position and magnitude of GWAS SNPs selected by MLM (Q+K) analysis at P = 0.01.
Figure 4.
Figure 4.
QTL and GWAS analyses for the chromosome 6 oil QTL and candidate gene DGAT1-2. A, NAM additive percentage oil content on a dry matter basis allelic effect estimates for the m708 QTL interval overlapping the DGAT1-2 genomic position. Red bars, NAM founders possessing a significant high oil allele; blue bar, NAM founder with a significant low oil allele relative to B73. B, NAM founder genotypes for all markers displaying significant associations in DGAT1-2. C, DGAT1-2 gene model showing the position of markers with significant associations. Note that DGAT1-2 is on the negative DNA strand. D, NAM GWAS and candidate gene association analysis for DGAT1-2. M2 is the Phe:indel previously determined to be the functional polymorphism for oil content at this locus (Zheng et al., 2008).

References

    1. Ascenzi R, Gantt JS. (1997) A drought-stress-inducible histone gene in Arabidopsis thaliana is a member of a distinct class of plant linker histone variants. Plant Mol Biol 34: 629–641 - PubMed
    1. Barton NH, Keightley PD. (2002) Understanding quantitative genetic variation. Nat Rev Genet 3: 11–21 - PubMed
    1. Benjamini Y, Hochberg Y. (1995) Controlling the false discovery rate: a practical and powerful approach to multiple testing. J Roy Stat Soc B Met 57: 289–300
    1. Bradbury PJ, Zhang Z, Kroon DE, Casstevens TM, Ramdoss Y, Buckler ES. (2007) TASSEL: software for association mapping of complex traits in diverse samples. Bioinformatics 23: 2633–2635 - PubMed
    1. Buchanan BB, Gruissem W, Jones RL. (2000) Biochemistry and Molecular Biology of Plants. American Society of Plant Biology, Rockville, MD

Publication types

LinkOut - more resources