. 2011:2011:859359.
doi: 10.1155/2011/859359. Epub 2011 Oct 23.

Deafferentation-induced redistribution of MMP-2, but not of MMP-9, depends on the emergence of GAP-43 positive axons in the adult rat cochlear nucleus

Affiliations

Deafferentation-induced redistribution of MMP-2, but not of MMP-9, depends on the emergence of GAP-43 positive axons in the adult rat cochlear nucleus

Michaela Fredrich et al. Neural Plast. 2011.

Abstract

The matrix metalloproteinases MMP-9 and MMP-2, major modulators of the extracellular matrix (ECM), were changed in amount and distribution in the rat anteroventral cochlear nucleus (AVCN) following its sensory deafferentation by cochlear ablation. To determine what causal relationships exist between the redistribution of MMP-9 and MMP-2 and deafferentation-induced reinnervation, kainic acid was stereotaxically injected into the ventral nucleus of the trapezoid body (VNTB) prior to cochlear ablation, killing cells that deliver the growth associated protein 43 (GAP-43) into AVCN. Deafferentation-induced changes in the pattern of MMP-9 staining remained unaffected by VNTB lesions. By contrast, changes in the distribution of MMP-2 normally evoked by sensory deafferentation were reversed if GAP-43 positive axons were prevented to grow in AVCN. In conclusion, GAP-43-containing axons emerging in AVCN after cochlear ablation seem to be causal for the maintenance of MMP-2-mediated ECM remodeling.


Figures
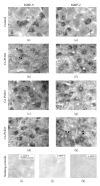
Figure 1
Figure 1
Time course and distribution of MMP-9 and MMP-2 realignments in AVCN on the side of cochlear ablation (CA), shown in 40 μm thick sections stained with DAB and flat embedded in epon. (a) In AVCN of control animals, numerous neurons were strongly immunoreactive for MMP-9 in their cytoplasm (arrows). (b and c) By POD1 and POD3, MMP-9 immunoreactivity decreased in the cytoplasm of most neuronal somata. Beaded collars of MMP-9 immunoreactive particles emerged close to the plasma membrane (arrowheads). (d) By POD7, the pattern of MMP-9 staining has almost returned to control level (a). (e) MMP-2 was strongly expressed in the cytoplasm of AVCN neurons in control animals. The white line indicated around the cytoplasm of one neuron shows the sample field for quantitative analysis of MMP-staining intensity in neuronal cytoplasm used to obtain the data shown in Figures 6 and 7(e). (f) By POD1, only marginal changes in MMP-2 staining were seen. A derangement seen in tissue texture is caused by disintegrating auditory nerve fibers. (g) By POD3, the content of MMP-2 in cytoplasm of AVCN neurons slightly decreased. (h) This decrease continued towards POD7 when beaded collars of MMP-2 positive particles became visible in direct vicinity to the cell's plasma membrane (arrowheads). (i) and (h) Neutralization of the primary antibody prior to the staining procedure (i) and omission of the primary antibody against MMP-9 (j) verified specificity of the immunostaining. (k) Omitting incubation with antibody raised against MMP-2 resulted in failure of staining. Global contrast adjustment was identical for all photographs in this figure. Scale bar: 20 μm.
Figure 2
Figure 2
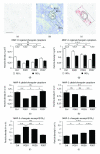
Semithin sections through AVCN stained for MMP-9 and MMP-2 immunoreactivity following cochlear ablation, and their quantitative evaluation. (a) By POD7, MMP-2 immunoreactivity showed up as particles. (b) Counterstaining of the same section with methylene blue, visualizing cellular boundaries. Lines indicate the regions of interest (ROI) sparing the cell nucleus (nu). (c) Same section as in (a) with the superimposed ROIs. Particles detected by computer-aided image analysis are indicated in red. Scale bar for (a)–(c) 20 μm. (d) Subcellular redistribution of MMP-9 immunoreactive particles in AVCN neurons in control animals (ctrl) and at POD1, 3 and 7 following cochlear ablation. Bars indicate particle density in ROI1 and ROI2. ns designates insignificant changes within ROI2 at any time. (e), (f) Changes in MMP-9 particle density in cytoplasm (e) and neuropil (f) of AVCN neurons in controls (ctrl) and by POD1, 3 and 7 following cochlear ablation. Bars indicate left-to-right (l/r) or ipsilateral-to-contralateral (i/c) ratio of particle density. (g) Subcellular redistribution of MMP-2 immunoreactive particles within the cytoplasm of AVCN neurons in control animals (ctrl) and by POD1, 3 and 7. (h), (i) Changes in MMP-2 particle density in cytoplasm (h) and neuropil (i) of AVCN neurons in control animals (ctrl) and by POD1, 3 and 7 following cochlear ablation.
Figure 3
Figure 3
Nissl staining used to document effectiveness and extent of KA injection into VNTB. (a, b) In the superior olivary complex of normal adult rats (a), numerous large neurons (arrows in (b)) were visible in VNTB (outlined in (a), (c), and (e)). Frames seen in (a), (c), and (e) indicate fields shown at high magnification in (b), (d), and (f). Dorsal (d) and medial (m) indicate orientation of brain sections. LSO: lateral superior olive; MNTB: medial nucleus of trapezoid body. (c), (d): VNTB with complete lesion (cL). All neurons have disappeared while glial cells (arrowheads in (d)) increased in number. (e, f) After incomplete VNTB lesions, neurons (arrows in (e) and (f)) survived in parts of VNTB (f). In the case shown in (e), medially residing neurons survived the injection (arrows) while most of the laterally residing neurons disappeared. Scale bar: 50 μm for (a), (c), and (e); 20 μm for (d), (d), and (f).
Figure 4
Figure 4
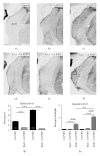
GAP-43 expression in AVCN after complete or incomplete VNTB lesion and subsequent cochlear ablation. (a) Little GAP-43 expression was found in AVCN of control animals. Inset: no staining occurred when omitting the primary antibody. (b, c) Following cochlear ablation, GAP-43 staining emerged around POD3 (b) and reached maximal intensity by POD7 (c). (d, e) Combining complete lesion of VNTB with cochlear ablation (KAcL + CA) led to near-complete failure of GAP-43 expression in AVCN. (f) In cases with incomplete lesion (KAiL + CA) of VNTB, GAP-43 staining failed only locally, producing a patchy staining in AVCN. Frames indicate test fields for quantitative analysis of local GAP-43 staining density. Scale bar in (a)–(f), including inset in (a) 200 μm. Global contrast adjustments are identical for all photographs shown. (g) Staining intensity of GAP-43 immunoreactivity in the AVCN given as gray tone mean. Bars indicate ipsilateral-to-contralateral ratio (i/c) for cases with CA alone and KAcL + CA at POD3 and POD7 following cochlear ablation. Asterisks indicate significant differences among groups, number signs (hash symbols) indicate significant differences against control. (h) Heterogeneity of GAP-43 staining in ipsilateral AVCN after CA, KAcL + CA, and KAiL + CA. Bars indicate ratio between the strongest and faintest GAP-43-stained region within the AVCN.
Figure 5
Figure 5
Time course of the distribution of MMP-9 and MMP-2 following combination of KA injection completely lesioning VNTB and cochlear ablation (KAcL + CA). (a)–(c) The distribution of MMP-9 showed no differences compared to the pattern following cochlear ablation alone (Figure 1(a)–1(d)). Compared to control animals (a), the cytoplasm of AVCN neurons (arrows in (a)) have lost MMP-9 by POD3 (b) but regained it till POD7 (c). Beaded collars close to the plasma membrane were particularly prominent around POD3 (arrowheads in (b)). (d–f) As in case with cochlear ablation alone (Figures 1(e)–1(h)), the cytoplasm of AVCN neurons partially lost their MMP-2 immunoreactivity by POD3 (e). By POD7, MMP-2 immunoreactivity in cytoplasm of neurons was almost back to control level (d) again (f). Scale bar: 20 μm. Global contrast adjustment was identical for all photographs in this figure.
Figure 6
Figure 6
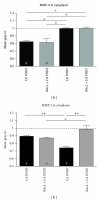
Statistical evaluation of the modulation of MMP-9- and MMP-2-staining intensity in the cytoplasm of AVCN neurons following cochlear ablation (CA) with or without a preceding complete lesion of VNTB (KAcL). (a, b) Bars indicate ipsilateral-to-contralateral ratios (i/c) of gray tone means of MMP-9 (a) and MMP-2 (b) measured in the cytoplasm of AVCN neurons (test field indicated in Figure 1(e)) following cochlear ablation or combination of KA injection with complete lesion of VNTB with cochlear ablation (KAcL + CA). The dashed lines mark a i/c ratio of 1, indicating control level. Whereas VNTB lesions have no influence on the loss and regain of MMP-9 from neuronal cytoplasm after cochlear ablation, MMP-2 levels return to control level by POD7 only if the reinnervation is prevented. Asterisks indicate significant differences among groups, number signs (hash symbols) indicate significant differences against control.
Figure 7
Figure 7
Distribution of MMP-2 in the ipsilateral AVCN on POD7 after incomplete lesion of VNTB due to KA injection followed by cochlear ablation. (a) Section through AVCN stained for MMP-2, showing a distinct border in the staining pattern of MMP-2 (black line). Frames indicate regions shown at higher magnification in (c) and (d). Arrowheads indicate blood vessels also found in the adjacent section shown in (b) stained for GAP-43. (b) In a section through AVCN parallel to the one shown in (a), GAP-43 expression shows a heterogeneity as well (black line) which closely corresponded to the border seen in (a). (c), (d) Photographs at high magnification taken of MMP-2 immunoreactivity in regions of AVCN corresponding to high expression level of GAP-43 (RGAP−43+) and low to no expression of GAP-43 ((RGAP−43−), respectively. Scale bar: 200 μm for (a), (b); 20 μm for (c), (d). (e) Quantitative evaluation of MMP-2-staining intensity in cytoplasm of local populations of AVCN neurons based on photographs like those shown in (c) and (d).

Similar articles

Cited by

References

    1. Kane EC. Patterns of degeneration in the caudal cochlear nucleus of the cat after cochlear ablation. Anatomical Record. 1974;179(1):67–92. - PubMed
    1. Oliver DL, Potashner SJ, Jones DR, Morest DK. Selective labeling of spiral ganglion and granule cells with D-asparatate in the auditory system of cat and guinea pig. Journal of Neuroscience. 1983;3(3):455–472. - PMC - PubMed
    1. Altschuler RA, Sheridan CE, Horn JW, Wenthold RJ. Immunocytochemical localization of glutamate immunoreactivity in the guinea pig cochlea. Hearing Research. 1989;42(2-3):167–174. - PubMed
    1. Illing R-B, Horváth M, Laszig R. Plasticity of the auditory brainstem: effects of cochlear ablation on GAP-43 immunoreactivity in the rat. Journal of Comparative Neurology. 1997;382(1):116–138. - PubMed
    1. Illing R-B, Kraus KS, Meidinger MA. Reconnecting neuronal networks in the auditory brainstem following unilateral deafening. Hearing Research. 2005;206(1-2):185–199. - PubMed

Publication types

LinkOut - more resources