. 2011 Dec 29;115(51):15332-8.
doi: 10.1021/jp2046867. Epub 2011 Dec 2.

Infrared study of the stability and folding kinetics of a series of β-hairpin peptides with a common NPDG turn

Affiliations

Infrared study of the stability and folding kinetics of a series of β-hairpin peptides with a common NPDG turn

Yao Xu et al. J Phys Chem B. .

Abstract

The thermal stability and folding kinetics of a series of 15-residue β-hairpins with a common Type I [3:5] NPDG turn were studied using Fourier transform infrared spectroscopy (FTIR) and laser-induced temperature jump (T-jump) with infrared detection, respectively. Mutations at positions 3, 5, or 13 in the peptide sequence SEXYXNPDGTWTXTE, where X represents the position of mutation, were performed to study the roles of hydrophobic interactions in determining the thermodynamic and kinetic properties of β-hairpin folding. The thermal stability studies show a broad thermal folding/unfolding transition for all the peptides. T-jump studies indicate that these β-hairpin peptides fold in less than 2 μs. In addition, both folding and unfolding rate constants decrease with increasing strength of hydrophobic interactions. Kinetically, the hydrophobic interactions have more significant influence on the unfolding rate than the folding rate. Φ-value analysis indicates that the hydrophobic interactions between the side chains are mainly formed at the latter part of the transition-state region during the folding process. In summary, the results suggest that the formation of the native structure of these β-hairpins depends on the correct topology of the hydrophobic cluster. Besides the formation of the turn region as a key process for folding as suggested by previous studies, a hydrophobic collapse process may also play a crucial role during β-hairpin folding.


Figures

Figure 1
Figure 1
(A) Equilibrium FTIR spectra of NPDGm3 in D2O phosphate buffer (pH* 7.0) at 3.6 °C (solid line), 38.4 °C (long dashed), 62.4 °C (medium dashed), and 86.2 °C (short dashed). Inset: Fourier self-deconvolution spectrum at 3.6 °C with k = 2 and full width half maximum = 18 cm-1. (B) Difference FTIR spectra that were generated by subtracting the spectrum collected at the lowest temperature (3.6 °C) from those obtained at 9.3 °C (solid line), 38.4 °C (long dashed), 62.4 °C (medium dashed), and 86.2 °C (short dashed).
Figure 2
Figure 2
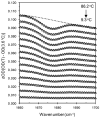
Difference FTIR spectra (Δ) of NPDGm3 in D2O phosphate buffer (pH* 7.0) in the high-frequency region. These spectra were generated by subtracting the FTIR collected at 3.6 °C from those collected at higher temperatures and adding an offset for clarity purpose. Solid lines are fit to a Gaussian function plus a nonlinear baseline term consisting of a Gaussian and linear function. The dotted line corresponds to the baseline of the difference spectrum at 86.2 °C.
Figure 3
Figure 3
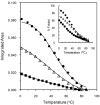
Integrated area of the 1680 cm-1 band versus temperature for NPDGm1 (■), NPDGm2 (Δ), and NPDGm3 (●). The solid lines correspond to the best fit of the data to a two-state model. Inset: the temperature dependence of the folded population of the three peptides. The folded population (f) was calculated from the equilibrium constant at temperature T using the relation Keq(T) = f/(1-f). The thermodynamic parameters are summarized in Table 2.
Figure 4
Figure 4
A representative relaxation kinetic trace (black) probed at 1634 cm-1 for NPDGm3 in 50mM phosphate buffer (pH* 7.0) with a T-jump from 18.5 to 28.1 °C. The solid line is the fit to the following function, ΔOD(t)=A*[1-B*exp(-t/τ)] with values of A = -0.00544, B = 0.475, and τobs= 1.13 μs. Residual analysis of the fit (gray) is also shown.
Figure 5
Figure 5
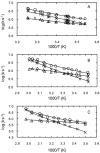
Arrhenius plots of the observed relaxation (○), folding (Δ), and unfolding (x) rate constants of (A) NPDGm1, (B) NPDGm2, and (C) NPDGm3. The folding and unfolding rate constants are calculated by using the Keq(T) determined from the FTIR measurements (Table 2). Both the folding and unfolding rate constants are fitted using the following equation: ln(k) = ln(D) - ΔG/RT, where D is a constant and set to 1010 s-1, and ΔG is the free energy of activation of folding or unfolding. The best fits are shown as solid lines. The top solid line represents the calculated relaxation rate constants which equal to the sum of the fitting values of the folding and unfolding rate constants.

Similar articles

Cited by

References

    1. Hughes RM, Waters ML. Curr Opin Struct Biol. 2006;16:514–524. - PubMed
    1. Sharpe T, Jonsson AL, Rutherford TJ, Daggett V, Fersht AR. Protein Sci. 2007;16:2233–2239. - PMC - PubMed
    1. Blanco F, Ramirez-Alvarado M, Serrano L. Curr Opin Struct Biol. 1998;8:107–111. - PubMed
    1. Kobayashi N, Honda S, Yoshii H, Munekata E. Biochemistry. 2000;39:6564–6571. - PubMed
    1. Cochran AG, Skelton NJ, Starovasnik MA. Proc Natl Acad Sci USA. 2001;98:5578–5583. - PMC - PubMed

Publication types