. 2011 Dec 2;12(12):R119.
doi: 10.1186/gb-2011-12-12-r119.

RNA-seq in grain unveils fate of neo- and paleopolyploidization events in bread wheat (Triticum aestivum L.)

Affiliations

RNA-seq in grain unveils fate of neo- and paleopolyploidization events in bread wheat (Triticum aestivum L.)

Caroline Pont et al. Genome Biol. .

Abstract

Background: Whole genome duplication is a common evolutionary event in plants. Bread wheat (Triticum aestivum L.) is a good model to investigate the impact of paleo- and neoduplications on the organization and function of modern plant genomes.

Results: We performed an RNA sequencing-based inference of the grain filling gene network in bread wheat and identified a set of 37,695 non-redundant sequence clusters, which is an unprecedented resolution corresponding to an estimated half of the wheat genome unigene repertoire. Using the Brachypodium distachyon genome as a reference for the Triticeae, we classified gene clusters into orthologous, paralogous, and homoeologous relationships. Based on this wheat gene evolutionary classification, older duplicated copies (dating back 50 to 70 million years) exhibit more than 80% gene loss and expression divergence while recent duplicates (dating back 1.5 to 3 million years) show only 54% gene loss and 36 to 49% expression divergence.

Conclusions: We suggest that structural shuffling due to duplicated gene loss is a rapid process, whereas functional shuffling due to neo- and/or subfunctionalization of duplicates is a longer process, and that both shuffling mechanisms drive functional redundancy erosion. We conclude that, as a result of these mechanisms, half the gene duplicates in plants are structurally and functionally altered within 10 million years of evolution, and the diploidization process is completed after 45 to 50 million years following polyploidization.


Figures
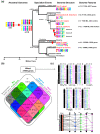
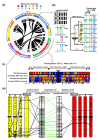
Figure 1
Figure 1
Homolog gene conservation between wheat and cereal sequenced genomes. (a) Cereal genome paleohistory. Schematic representation of the phylogenetic relationships between grass species adapted from [2,4]. Divergence times from a common ancestor are indicated below the branches of the phylogenetic tree (in million years). Whole genome duplication events are illustrated with red circles on the tree branches. The evolution of chromosome numbers of modern species from the ancestral genome structure is indicated with the number of chromosome fusion (CF) events. Genome features (number of chromosomes, physical size, and the number of annotated unigenes) of the six cereal genomes investigated are shown at the right-hand side. Modern genome architectures are illustrated using a color code that represents the n = 5 and 12 extinct ancestors (left). (b) Homologous gene groups between wheat and rice, Brachypodium, sorghum, and maize genomes. The Venn diagram illustrates the number of conserved protein domain-based homologs between wheat (RNA-seq gene clusters) and rice/Brachypodium/sorghum/maize (annotated proteins). (c) Simulated synteny-based gene order model in bread wheat. The chromosomal location of the RNA-seq gene clusters are shown on the seven bread wheat chromosome groups based on a consensus gene order derived from the observed synteny between wheat and rice ('R', in green), Brachypodium ('B', in grey), sorghum ('S', in blue), and maize ('M', in pink) chromosomes (numbers are shown at the bottom of the chromosomes). The bottom inset illustrates a micro-synteny example of 26 re-ordered genes in bread wheat chromosome 1 (red dots) based on orthologous genes identified in Brachypodium (chromosome 2, 92 annotated genes, 0.9 Mb), sorghum (chromosome 9, 108 annotated genes, 1.1 Mb), rice (chromosome 5, 112 annotated genes, 0.9 Mb), maize (chromosomes 6 to 8, 145 annotated genes, 12.6 Mb). Non-conserved genes are illustrated using dotted lines and conserved genes are linked with black lines.
Figure 2
Figure 2
Heterologous genome-wide wheat expression map. (a) The five Brachypodium chromosomes are illustrated in the inner circle (labeled Bd) and the seven paleoduplications (in black) shared within cereals are displayed in the center (Dp1 to Dp7). The second circle (labeled Ta) illustrates the orthologous relationships identified between Brachypodium and wheat using a seven color code. Dots around the two circles illustrate the Brachypodium transcription factors (red; labeled TFTa), the 454 RNA-seq reads from bread wheat (black; labeled 454Ta) and associated TFs (green; labeled TFBb). (b) CNVs and homoeologous gene localization in bread wheat is illustrated with a single COS marker (CT753726) that has been located on chromosome 2A (CNV of 2), 2B and 2D using the adapted cytogenetic material illustrated in the top. The arrows illustrate the observed amplification loss observed for the illustrated cytogenetic material (N2A, N2B, N2D respectively for the absence of the 2A, 2B, 2D chromosomes). The COS marker (CT753726) expression (SSCP amplification) profiles observed in the five RNA samples from wheat grain development, as well as in leaves (RNA and DNA amplifications) and roots (RNA) considered as negative control. Colored arrows highlight the loss of expression of the considered CNV or homoeologous copies. (c) Wheat (chromsomes 1 to 3) and Brachypodium (chromosome 2) heat maps for Brachydopium coding sequence (CDS; blue < 40, yellow approximately 41 to 50, red > 51 genes/500 kb), wheat RNA-seq ortholog (blue < 9, yellow approximately 10 to 19, red > 20 genes/500 kb), Brachypodium paralog (blue = 0, yellow approximately 1 to 5, red > 6 genes/500 kb), wheat RNA-seq paralog (blue = 0, yellow approximately 1 to 3, red > 4 genes/500 kb) distributions. The 44 RNA-seq TFs are illustrated with their corresponding orthologous positions on the Brachypodium chromosome as black vertical bars. (d) Paralogous chromosomal regions are shown in the center, involving Brachypodium chromosome 1 (2.1 Mb, 252 genes) and 3 (2.9 Mb, 181 genes), and annotated genes are shown with horizontal bars. Orthologous wheat chromosomes are shown at the right (consensus group 1 and homoeologous chromosomes in red) and left (consensus group 4 and homoeologous chromosomes in yellow). Orthologous genes identified between wheat and Brachypodium are linked with black lines. Paralogous genes identified between Brachypodium chromosomes are linked with green lines. Expression data from wheat RNA-seq cluster alignment against the considered Brachypodium chromosome sequences are shown with colored dots. Blue dots illustrate paralogous gene pairs for which only one copy is associated with wheat RNA-seq clusters while red dots illustrate paralogous pairs for which both duplicates are associated with wheat RNA-seq clusters.
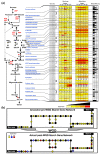
Figure 3
Figure 3
Comparative evolution of the starch gene network between rice and wheat. (a) Twenty-nine enzyme-encoding genes involved in the starch biosynthesis network are listed at the left and 170 genes (named according to their accession numbers) are shown. Expression data from oligo-array experiments performed in rice and wheat are displayed using a classical colored scale in which yellow illustrates the absence of expression and red the observed highest level of expression (6.5 for rice, 14.5 for wheat as normalized intensity). At the right are illustrated orthologous RNA-seq clusters from one up to three homoeologous copies (black scares). (b) The starch gene network is schematically represented with black dots representing synthesized substrate and the number of gene-encoding enzymes is shown in circles. The pre-WGD (top) and post-WGD (bottom) networks illustrate the impact of paleoduplication where no impact (yellow), gain of an additional enzyme-encoding gene (blue) and more than one additional enzyme-encoding gene (red) are shown.
Figure 4
Figure 4
Correlation between CNV and synteny erosion between Brachypodium and wheat. At the right is illustrated the wheat chromosome 3B subdivided into eight deletion bins surrounding the centromere. The number of available mapped ESTs per bin is illustrated with blue bars whereas the number of conserved orthologous sets (COS) is shown with red bars. The three deletion bins associated with the lowest percentage of COS regarding the number of available mapped ESTs are indicated by red stars. At the left is illustrated the Brachypodium chromosome 2 subdivided into orthologous chromosomal relationships with wheat chromosomes 1 (in red) and 3 (in green). The wheat RNA-seq clusters are shown according to their orthologous positions on Brachypodium chromosome 2 as homoeologs (black dots) or additional CNVs (red dots). At the center are shown the Brachypodium/wheat orthologous genes linked with colored lines according to their position within the wheat deletion bins.
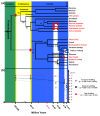
Figure 5
Figure 5
Temporal model of structural and functional gene shuffling in plants. (a) Schematic representation of the phylogenetic relationships between angiosperm species. Divergence times from a common ancestor are indicated on the branches of the phylogenetic tree (in million years). Sequenced genomes are indicated in red. WGD events are illustrated with red circles on the tree branches. (b) The percentage of total and structural (gene loss) or functional (neo-subfunctionalization) gene shuffling discussed in the article (referred to as data point 'X' in the text) and observed during the last 100 million years of evolution are plotted as dotted red, black and grey logarithmic curves.

Similar articles

Cited by

References

    1. Ohno S. Evolution by Gene Duplication. Berlin: Springer-Verlag; 1970. p. 160.
    1. Salse J, Abrouk M, Murat F, Quraishi UM, Feuillet C. Improved standards and new comparative genomics tools provide new insights into grasses paleogenomics. Brief Bioinf. 2009;10:619–630. doi: 10.1093/bib/bbp037. - DOI - PubMed
    1. Salse J, Abrouk M, Bolot S, Guilhot N, Courcelle E, Faraut T, Waugh R, Close TJ, Messing J, Feuillet C. Reconstruction of monocotelydoneous proto-chromosomes reveals faster evolution in plants than in animals. Proc Natl Acad Sci USA. 2009;106:14908–14913. doi: 10.1073/pnas.0902350106. - DOI - PMC - PubMed
    1. Abrouk M, Murat F, Pont C, Messing J, Jackson S, Faraut T, Tannier E, Plomion C, Cooke R, Feuillet C, Salse J. Palaeogenomics of plants: synteny-based modelling of extinct ancestors. Trends Plant Sci. 2010;15:479–487. doi: 10.1016/j.tplants.2010.06.001. - DOI - PubMed
    1. Doyle JJ, Flagel LE, Paterson AH, Rapp RA, Soltis DE, Soltis PS, Wendel JF. Evolutionary genetics of genome merger and doubling in plants. Annu Rev Genet. 2008;42:443–461. doi: 10.1146/annurev.genet.42.110807.091524. - DOI - PubMed

Publication types