. 2011 Dec 9;147(6):1257-69.
doi: 10.1016/j.cell.2011.10.041. Epub 2011 Dec 1.

Structural basis for promoter-10 element recognition by the bacterial RNA polymerase σ subunit

Affiliations

Structural basis for promoter-10 element recognition by the bacterial RNA polymerase σ subunit

Andrey Feklistov et al. Cell. .

Abstract

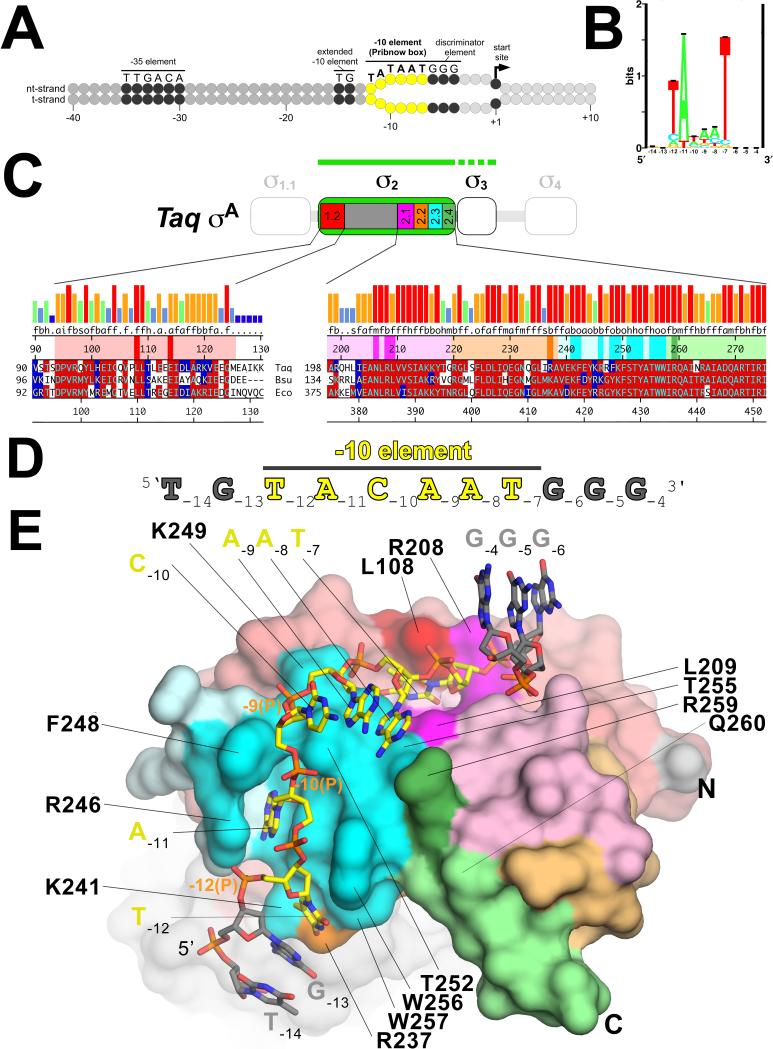
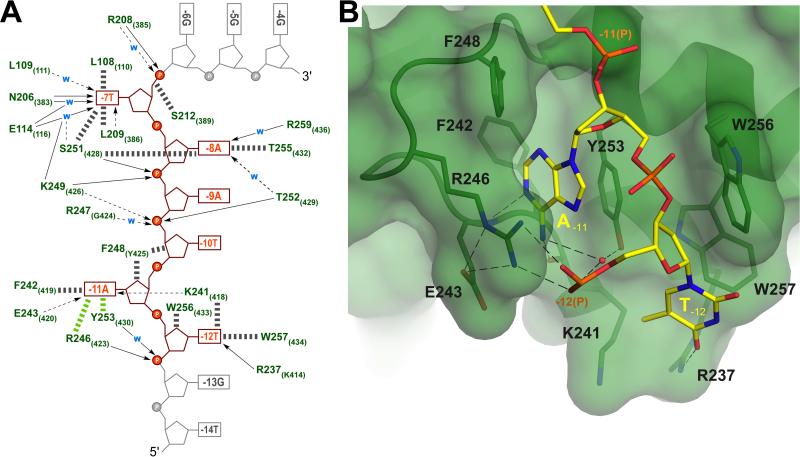
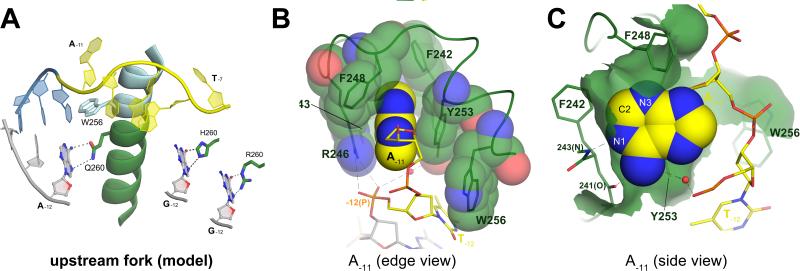
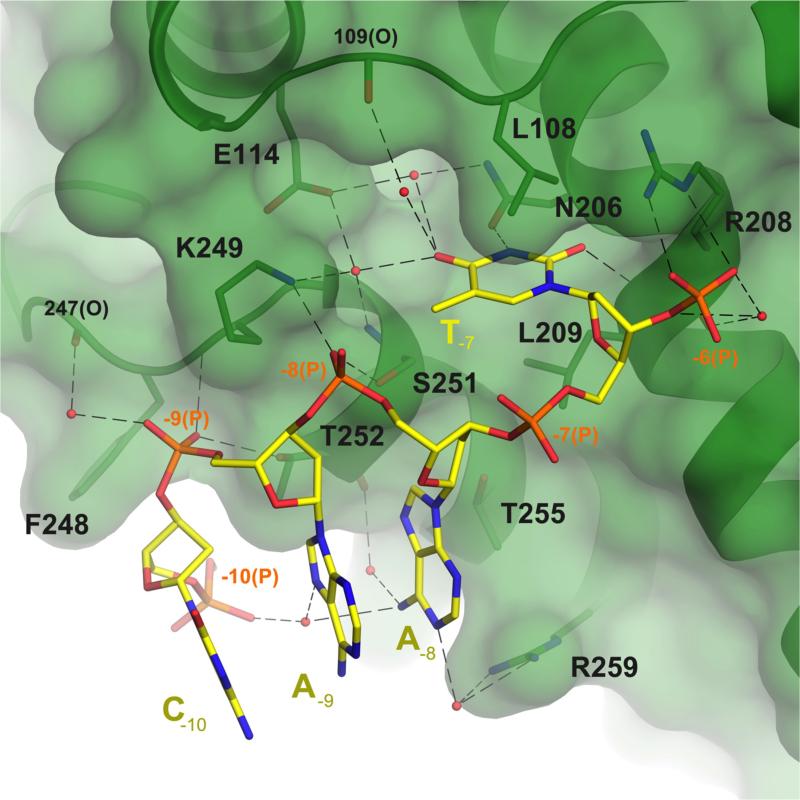
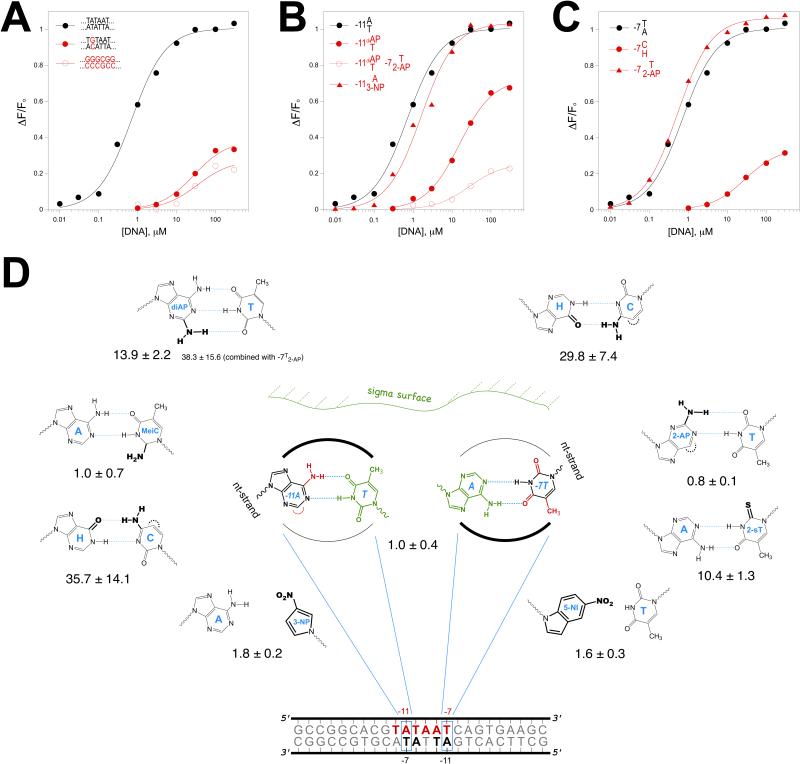
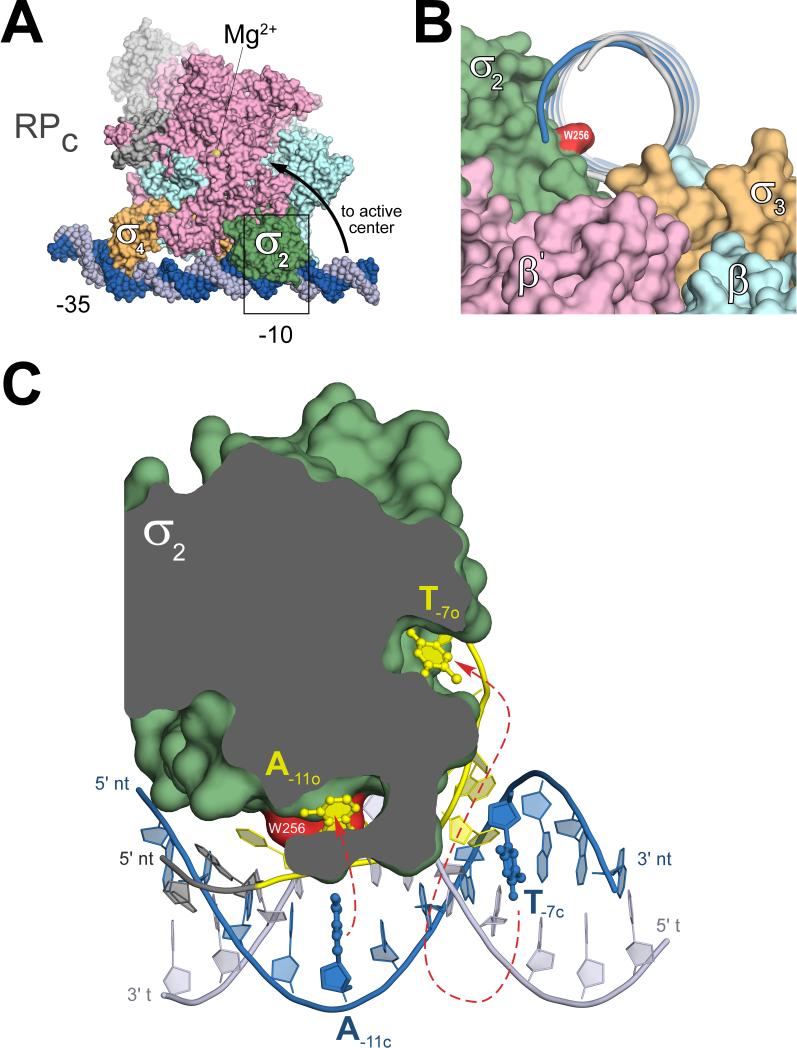
The key step in bacterial promoter opening is recognition of the -10 promoter element (T(-12)A(-11)T(-10)A(-9)A(-8)T(-7) consensus sequence) by the RNA polymerase σ subunit. We determined crystal structures of σ domain 2 bound to single-stranded DNA bearing-10 element sequences. Extensive interactions occur between the protein and the DNA backbone of every -10 element nucleotide. Base-specific interactions occur primarily with A(-11) and T(-7), which are flipped out of the single-stranded DNA base stack and buried deep in protein pockets. The structures, along with biochemical data, support a model where the recognition of the -10 element sequence drives initial promoter opening as the bases of the nontemplate strand are extruded from the DNA double-helix and captured by σ. These results provide a detailed structural basis for the critical roles of A(-11) and T(-7) in promoter melting and reveal important insights into the initiation of transcription bubble formation.


Figures

Figure 1
Figure 1. Bacterial promoter architecture, -10 element, RNAP σ factor, crystallization oligonucleotide, and structural overview (also see Figure S1 and Table S1)
A. Promoter motifs recognized by primary bacterial RNAP σ factors. Grey circles represent the DNA nucleotides (top, nt-strand; bottom, t-strand). The extent of the transcription bubble in RPo is illustrated (separated circles). Promoter motifs recognized by primary σ factors are colored black (-35 element, extended –10 element, discriminator element) or yellow (-10 element or Pribnow box), with the consensus sequences above. The position with respect to the transcription start-site (+1) is denoted below. B. Sequence logo (Schneider and Stephens, 1990) for the bacterial primary σ factor –10 element (adapted from (Shultzaberger et al., 2006). C. Taq σA domain architecture, crystallization construct, and sequence characteristics. The domain architecture of Taq σA is represented schematically (structured domains, thick regions; flexible linker, thin regions; (Campbell et al., 2002). The crystallization construct, comprising σ2–3, is highlighted. The green bar above indicates that σ2 was ordered in the crystal structure (solid bar) while σ3 was disordered (dashed bar). The conserved regions within σ2 (Lonetto et al., 1992) are labeled and color-coded. Expanded below is a sequence alignment of the σ2 conserved regions for Taq σA, Bacillus subtilis (Bsu) σA, and E. coli σ70. Sequences are shown in one-letter amino acid code. Numbers at the beginning of each line indicate the amino acid positions. Number scales at the top and bottom indicate amino acid position in Taq σA, and E. coli σ70, respectively. The sequence blocks are color-coded according to the schematic above; the darker bands of color denote protein side-chains that interact with the DNA. Amino acid identity in >50% of the sequences is indicated by a red background, amino acid similarity by a blue background. Groups of residues considered similar are: ST (h), RK (b), DE (a), NQ (m), FYW (o), and ILVM (f). The histogram at the top represents the level of sequence conservation (using the groups denoted above) at each position in an alignment of 50 primary bacterial RNAP σ factors (Campbell et al., 2002). Sequence conservation of 100% is represented by a tall red bar, less than 20% by a small dark blue bar, intermediate levels are represented by orange, light green, and light blue bars. D. Crystallization oligonucleotide. Synthetic 11mer ssDNA oligonucleotide used for crystallization (Feklistov et al., 2006). The –10 element is colored yellow and labeled. E. Structural overview. The σA2 protein is shown as a molecular surface and color-coded as in Figure 1C (conserved regions shown in pale colors, residues with side-chains that interact with the DNA shown in darker colors). Selected residues are labeled (see text). The ssDNA is shown with carbon atoms color-coded as in Figure 1D. Other atoms are colored as follows: nitrogen, blue; oxygen, red; phosphorous, orange.
Figure 2
Figure 2. DNA/protein contacts and recognition of T-12A-11
A. Schematic showing DNA/protein contacts. Arrows indicate direct or water-mediated (blue W) hydrogen bonds from side chain (solid) or main chain (dashed) protein atoms. Van der Waals contacts are shown by thick grey dashed lines, stacking/cation-π interactions are shown by thick green dashed lines. The numbers indicate amino acid positions for Taq σA and E. coli σ70 (in brackets). Grey areas of the oligo indicate regions without biologically relevant contacts. B. The σA2 protein is shown as an α-carbon backbone ribbon and with a transparent molecular surface (green). Selected protein side chains are shown and labeled. The ssDNA is shown as in Figure 1E (nucleotides upstream of T-12 have been omitted for clarity). An ordered water molecule is shown as a small red sphere. Polar interactions (H-bonds and/or salt bridges) are denoted (grey dashed lines).
Figure 3
Figure 3. Details of T-12A-11 recognition (also see Figure S2)
A. Modeling of the upstream fork junction and recognition of the (T/A)-12 bp. The upstream dsDNA is modeled as B-form double-helix based on (Murakami et al., 2002). In the modeled portion of the DNA, the nt-strand is colored blue; t-strand, grey. The α-helix formed by σ regions 2.3 (turquoise) and 2.4 (green) is shown as a ribbon. The side-chains of W256 (blocks extension of DNA double-helix downstream past the -12 bp and occupies the space vacated by the flipped A-11) and Q260 (positioned to interact with the major-groove surface of the t-strand A base-paired to T-12) are shown. Modeling of the recognition of the mutant (C/G)-12 base pair by Q260H (Waldburger et al., 1990) or Q260R (Kenney et al., 1989) is shown on the right. B. Edge view of A-11 base. The ssDNA is shown with the atoms of the A-11 base in CPK format. An ordered water molecule is shown as a small red sphere. Polar interactions (H-bonds and/or salt bridges) are denoted (grey dashed lines). The σA2 protein is shown as a worm. Side chains that make up the A-11 binding pocket are shown with transparent CPK atoms. C. Side view of A-11 base. The A-11 binding pocket has been sliced near the level of the base and is viewed from the side. The molecular surface of σA2 within 4.5 Å of the A-11 nucleotide is shown as a transparent surface.
Figure 4
Figure 4. Recognition of C-10A-9A-8T-7 (also see Figure S2)
The σA2 protein, selected protein side chains, the ssDNA, ordered water molecules, as well as polar interactions (H-bonds and/or salt bridges) are shown as in Figure 2B.
Figure 5
Figure 5. Interactions of -10 element dsDNA with RNAP holoenzyme (also see Figure S2)
A, B, C. Binding isotherms for dsDNA fragments to RNAP holoenzyme. Shown are representative curves for the binding of σ[211-Cys-Alexa555]-holoenzyme at increasing dsDNA concentration as measured using the RNAP beacon assay (Experimental Procedures; (Mekler et al., 2011). Sequences/modifications are shown above binding curves on the left. D. Summary of DNA modifications studied. Schematic showing orientation of the (A/T)-11 and (T/A)-7 base pairs in relation to the DNA-binding surface of σ2. Modifications decreasing the binding of the dsDNA promoter fragment (sequence shown at the bottom) are highlighted in red, neutral modifications are green. The -10 element sequence on the nt-stand is shown in red, -10-like element sequence on the opposite strand is shown in bold. Modified base pairs investigated in this study are shown on the left [for (A/T)-11 base pair] and right [for (T/A)-7 base pair]. Changes from the canonical A/T base pair are highlighted in bold. Measured Kd values (μM) are shown underneath each modification. For each modification, Kd measurements were independently repeated two or three times, and averages were calculated. The experimental variation among replicate measurements usually did not exceed 20% of the average value.
Figure 6
Figure 6. Structural model of -10 element recognition
A. A model of RPc (adapted from (Murakami et al., 2002). Taq RNAP holoenzyme is shown as a molecular surface (α subunits, ω, grey; β, cyan; β', pink; σ is orange, except σ2, which is green). The position of the RNAP active site Mg2+-ion is illustrated by a yellow sphere (viewed through the β’-subunit). The thick black arrow indicates how the dsDNA downstream of the -10 element must move to enter the RNAP active site channel. The DNA t-strand is colored grey, the nt-strand blue, with the –35 and –10 elements labeled. The boxed region is shown in more detail in Figure 6C. B. View of the RPc model down the DNA helix axis (the DNA is shown as a P-backbone worm) with the downstream direction into the page. The DNA double-helix sits in a shallow trough formed by σ2, σ3, and β. W256 of σ2, which protrudes into the DNA helix at the position of the -11 bp, is colored red. C. Magnified view showing σ2, the dsDNA of the RPc model (with A-11c and T-7c highlighted), and the bound nt-strand ssDNA representing RPo (yellow). The σ2 is partially cut-away to reveal the A-11o and T-7o binding pockets. The wedge residue W256 is highlighted in red. Red arrows connect A-11 and T-7 of RPc with the same nucleotides of RPo.

Comment in

Similar articles

Cited by

References

    1. Campbell EA, Muzzin O, Chlenov M, Sun JL, Olson CA, Weinman O, Trester-Zedlitz ML, Darst SA. Structure of the bacterial RNA polymerase promoter specificity sigma factor. Mol Cell. 2002;9:527–539. - PubMed
    1. Chen J, Darst SA, Thirumalai D. Promoter melting triggered by bacterial RNA polymerase occurs in three steps. Proc Natl Acad Sci USA. 2010;107:12523–12528. - PMC - PubMed
    1. Chen YF, Helmann JD. The Bacillus subtilis flagellar regulatory protein σD: Overproduction, domain analysis and DNA-binding properties. J Mol Biol. 1995;249:743–753. - PubMed
    1. Cheong C, Tinoco IJ, Chollet A. Thermodynamic studies of base pairing involving 2,6-diaminopurine. Nucleic Acids Res. 1988;16:5115–5122. - PMC - PubMed
    1. Davies DR, Goryshin IY, Reznikoff WS, Rayment I. Three-dimensional structure of the Tn 5 synaptic complex transposition intermediate. Science. 2000;289:77–85. - PubMed

Publication types

MeSH terms

LinkOut - more resources