. 2012 Mar;120(3):310-20.
doi: 10.1016/j.bandl.2011.10.006. Epub 2011 Dec 1.

Co-localisation of abnormal brain structure and function in specific language impairment

Affiliations

Co-localisation of abnormal brain structure and function in specific language impairment

Nicholas A Badcock et al. Brain Lang. 2012 Mar.

Abstract

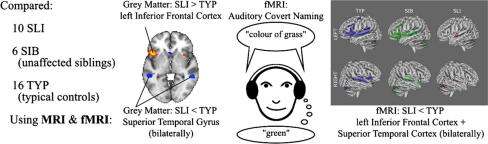
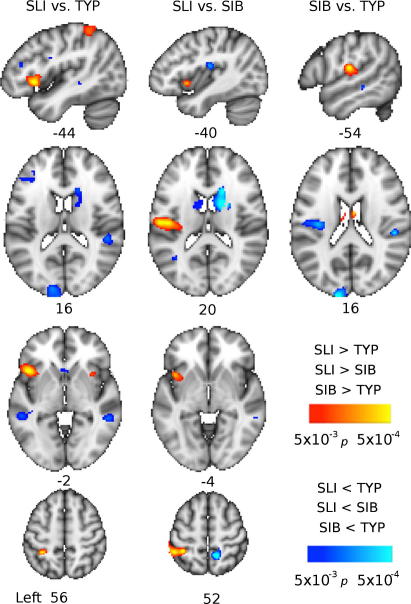
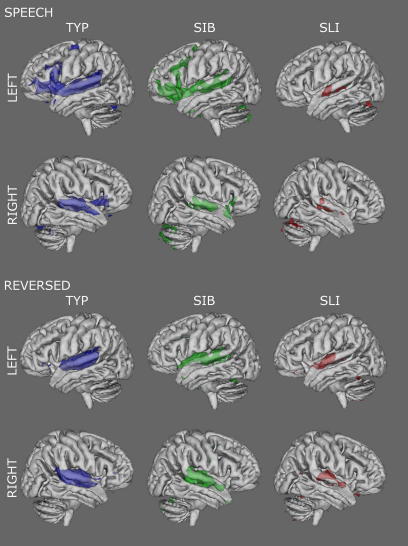
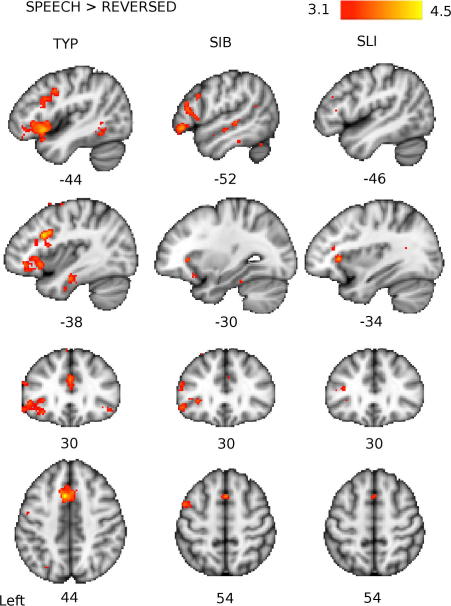
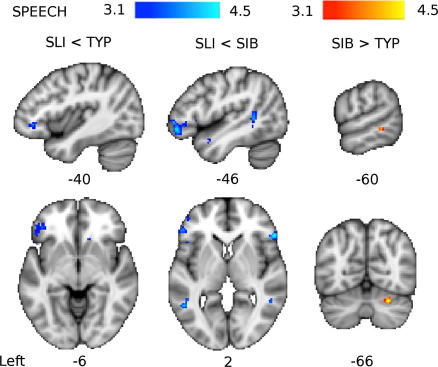
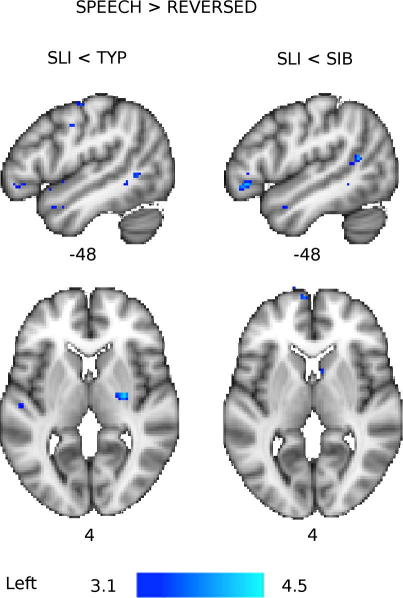
We assessed the relationship between brain structure and function in 10 individuals with specific language impairment (SLI), compared to six unaffected siblings, and 16 unrelated control participants with typical language. Voxel-based morphometry indicated that grey matter in the SLI group, relative to controls, was increased in the left inferior frontal cortex and decreased in the right caudate nucleus and superior temporal cortex bilaterally. The unaffected siblings also showed reduced grey matter in the caudate nucleus relative to controls. In an auditory covert naming task, the SLI group showed reduced activation in the left inferior frontal cortex, right putamen, and in the superior temporal cortex bilaterally. Despite spatially coincident structural and functional abnormalities in frontal and temporal areas, the relationships between structure and function in these regions were different. These findings suggest multiple structural and functional abnormalities in SLI that are differently associated with receptive and expressive language processing.


Figures

None
Graphical abstract
Fig. 1
Fig. 1
Group differences in grey matter volume revealed by voxel-based morphometry. Coloured maps show the p-value (thresholded at p < 0.005 for display purposes only) for comparisons between groups: Typical (TYP), Siblings (SIB), and SLI. Red–yellow areas have more grey matter in the SLI group compared to the SIB and TYP groups and the SIB group compared to the TYP group. Blue-light-blue areas have less grey matter in the SLI group compared to the SIB and TYP groups and the SIB group compared to the TYP group. Maps are presented on the standard MNI152 T1-weighted brain. Numbers below images indicate the coordinate in mm of that slice in x (for sagittal, top row) and z (for axial, second, third and bottom rows) relative to the orthogonal planes through the anterior commissure.
Fig. 2
Fig. 2
Group averages for the Speech and Reversed Speech contrasts with baseline. Three-dimensional statistical maps of left (top) and right (bottom) hemisphere activations are presented for Typically developing (TYP, purple), Siblings (SIB, green), and SLI (red) groups. Coloured activations are presented for the Speech (top) and Reversed Speech (bottom) conditions compared to baseline at a threshold of Z > 3.1 (p < 0.001, uncorrected) and above.
Fig. 3
Fig. 3
Group averages of brain activity for the Speech > Reversed contrast. Coloured maps show the Z-statistic (thresholded at Z > 3.1) for each group: Typical (TYP), Siblings (SIB), and SLI. Red-yellow areas have more activity in the Speech condition relative to the Reversed Speech condition. Maps are presented on the standard MNI152 T1-weighted brain. Numbers below images indicate the coordinate in mm of that slice in x (for sagittal, top two rows), y (for coronal, third row) and z (for axial, bottom row) relative to the orthogonal planes through the anterior commissure.
Fig. 4
Fig. 4
Group differences in brain activity for the Speech contrast with baseline. Coloured maps show the Z-statistic (thresholded at Z > 3.1) for comparisons between groups: Typical (TYP), Siblings (SIB), and SLI. Red–yellow areas have more activity in the SIB group compared to the TYP group. Blue-light-blue areas have less activity in the SLI group compared to the SIB and TYP groups. Maps are presented on the standard MNI152 T1-weighted brain. Numbers below images indicate the coordinate in mm of that slice in x (for sagittal, top row), y (for coronal, right image bottom row) and z (for axial, left and centre images bottom row) relative to the orthogonal planes through the anterior commissure.
Fig. 5
Fig. 5
Group differences in brain activity for the Speech > Reversed contrast. Coloured maps show the Z-statistic (thresholded at Z > 3.1) for comparisons between groups: Typical (TYP), Siblings (SIB), and SLI. Blue-light-blue areas have less activity in the SLI group compared to the SIB and TYP groups. Maps are presented on the standard MNI152 T1-weighted brain. Numbers below images indicate the coordinate in mm of that slice in x (for sagittal, top row) and z (for axial, bottom row) relative to the orthogonal planes through the anterior commissure.
Fig. 6
Fig. 6
Laterality indices for functional activation in the frontal and temporal lobes. Data for individual participants are shown for Typical (TYP: circles), Sibling (SIB: squares), and Specific Language Impairment (SLI: triangles) groups for frontal (top row) and temporal lobes (bottom row) for the Speech, Reversed Speech (Reversed), and Speech greater than Reversed (Sp > Rev) contrasts. Error bars represent the standard error of the mean and the x-axis has been reversed so that laterality indices to the left of centre represent left lateralisation and values to the right represent right lateralisation. Additional lines have been placed at 0.2 and −0.2 as an indication of divisions for left, bilateral, and right lateralisation (see text). Left-handed individuals’ data points are bolded.

References

    1. Andersson, J. L. R., Jenkinson, M., & Smith, S. M. (2007a). Non-linear optimisation. FMRIB technical report TR07JA1 from www.fmrib.ox.ac.uk/analysis/techrep. FMRIB technical report TR07JA1 <www.fmrib.ox.ac.uk/analysis/techrep>.
    1. Andersson, J. L. R., Jenkinson, M., & Smith, S. M. (2007b). Non-linear registration, aka spatial normalisation. FMRIB technical report TR07JA2 <www.fmrib.ox.ac.uk/analysis/techrep>.
    1. Badcock, N. A., Nye, A., & Bishop, D. V. M. (in press). Using functional transcranial doppler ultrasonography to assess language lateralization: Influence of task and difficulty level. Laterality. - PMC - PubMed
    1. Barry J.G., Hardiman M.J., Line E., White K.B., Yasin I., Bishop D.V.M. Duration of auditory sensory memory in parents of children with SLI: A mismatch negativity study. Brain and Language. 2008;104(1):75–88. - PubMed
    1. Barry J.G., Yasin I., Bishop D.V.M. Heritable risk factors associated with language impairments. Genes, Brain, and Behavior. 2007;6(1):66–76. - PMC - PubMed

Publication types

MeSH terms