. 2011 Dec 13;20(6):701-14.
doi: 10.1016/j.ccr.2011.11.002. Epub 2011 Dec 1.

VCAM-1 promotes osteolytic expansion of indolent bone micrometastasis of breast cancer by engaging α4β1-positive osteoclast progenitors

Affiliations

VCAM-1 promotes osteolytic expansion of indolent bone micrometastasis of breast cancer by engaging α4β1-positive osteoclast progenitors

Xin Lu et al. Cancer Cell. .

Abstract

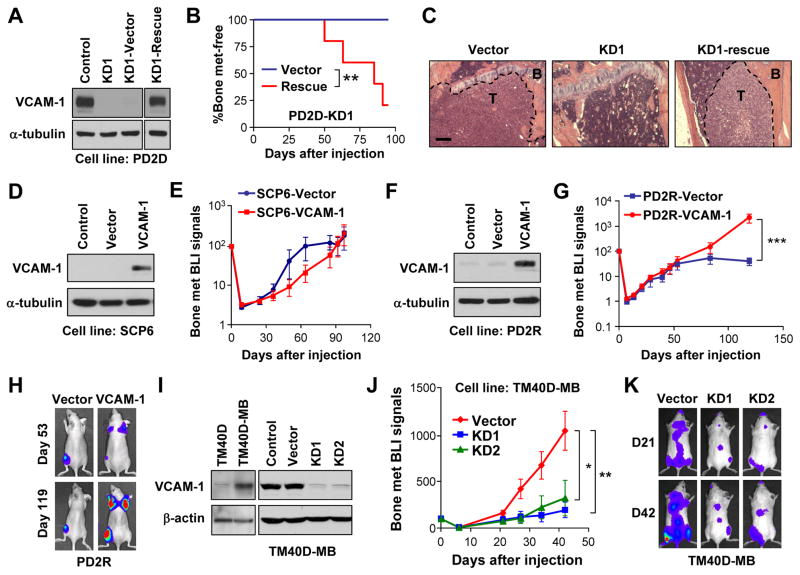
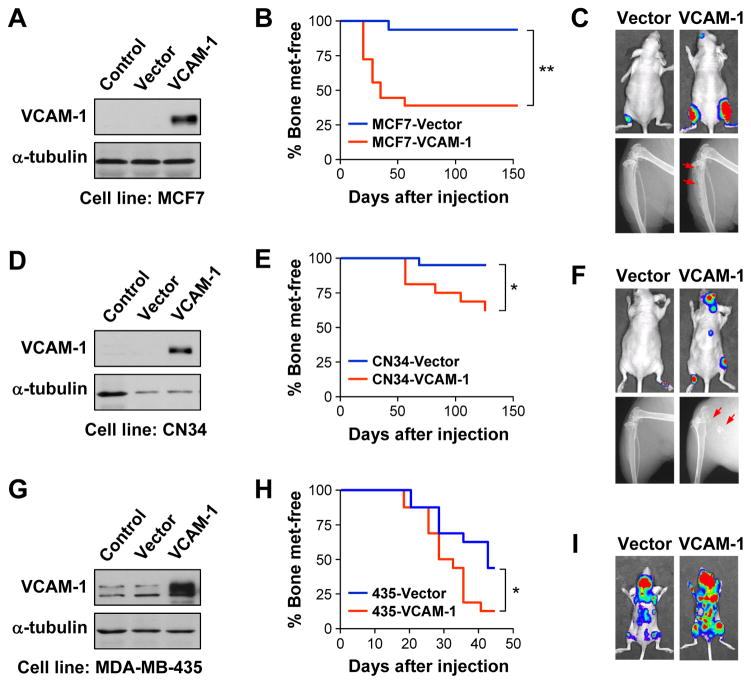
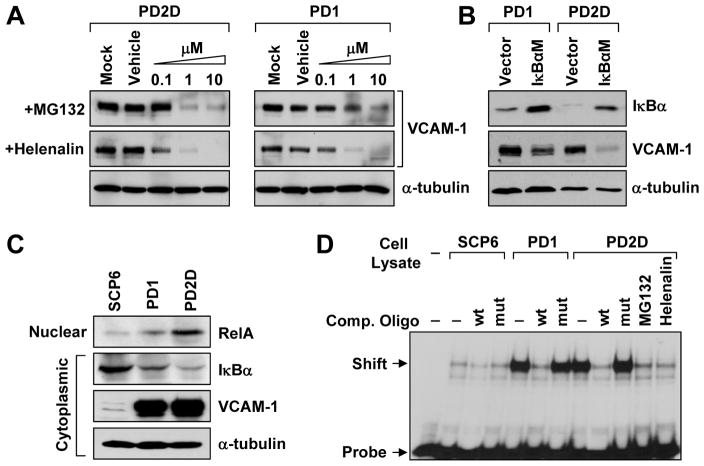
Breast cancer patients often develop locoregional or distant recurrence years after mastectomy. Understanding the mechanism of metastatic recurrence after dormancy is crucial for improving the cure rate for breast cancer. Here, we characterize a bone metastasis dormancy model to show that aberrant expression of vascular cell adhesion molecule 1 (VCAM-1), in part dependent on the activity of the NF-κB pathway, promotes the transition from indolent micrometastasis to overt metastasis. By interacting with the cognate receptor integrin α4β1, VCAM-1 recruits monocytic osteoclast progenitors and elevates local osteoclast activity. Antibodies against VCAM-1 and integrin α4 effectively inhibit bone metastasis progression and preserve bone structure. These findings establish VCAM-1 as a promising target for the prevention and inhibition of metastatic recurrence in bone.


Figures

Figure 1
Figure 1. Identification of VCAM-1 as a bone metastasis gene in a mouse model of metastatic dormancy and activation
(A) Relationship of parental SCP6 and post-dormancy (PD) sublines. Sublines with strong bone-metastatic ability were color-coded in red and sublines with weak bone-metastatic ability were color-coded in green. (B-C) Kaplan-Meier curve of bone metastasis development of different cell lines with BLI of representative mice. N=10. (D) Supervised clustering of samples using genes differentially expressed between weak (green) and strong (red) bone-metastatic cell lines. Genes highlighted in red were functionally tested. (E) Differential expression of VCAM-1 in parental and PD sublines detected by western blot. (F) VCAM-1 KD in PD2D as detected by western blot. (G) Kaplan-Meier curve of bone metastasis development of the indicated PD2D cells. N=8. **p < 0.01, #p > 0.1 by log-rank test. (H) Representative BLI of mice from (G) on Day 63 and Day 112. (I) Representative X-radiographs with arrows pointing to osteolytic lesions. See also Figure S1 and Table S1.
Figure 2
Figure 2. Essential role of VCAM-1 in bone metastasis
(A) Rescued VCAM-1 expression in the VCAM-1-KD PD2D subline as detected by western blot. (B) Kaplan-Meier representation of bone metastasis relapse by control and VCAM-1-rescued cell lines in (A). N=6. **p < 0.01 by log-rank test. (C) H&E staining of tibia showing presence or absence of overt metastatic tumors (T) in bone (B) by different tumor cells. Scale bar 200μm. (D) Ectopic overexpression of VCAM-1 in SCP6 as detected by western blot. (E) BLI curves of in vivo bone metastasis assay with SCP6 variants. Data represent mean ± SD. N=6. No time point showed statistic significance by Mann-Whitney test. (F) Ectopic overexpression of VCAM-1 in PD2R as detected by western blot. (G) BLI curves of bone metastasis development by control and VCAM-1-overexpressing PD2R cells. Data represent mean ± SEM. N=10. ***p < 0.001 by Mann-Whitney test. (H) Representative BLI of mice in (G). (I) Endogenous expression of VCAM-1 in the murine cell line TM40D and the subline TM40D-MB, and VCAM-1 KD in TM40-MB, as detected by western blot. (J) BLI curves of bone metastasis development by the indicated TM40D-MB cells. Data represent mean ± SEM. N=10. *p < 0.05, **p < 0.01 by Mann-Whitney test. (K) Representative BLI of mice in (J) on Day 21 and Day 42. See also Figure S2.
Figure 3
Figure 3. Pro-metastatic activity of VCAM-1 in additional bone metastasis models
(A) Ectopic overexpression of VCAM-1 in MCF7 as detected by western blot. (B) Kaplan-Meier curve of bone metastasis development of control and overexpression MCF7 cells. N=10. **p < 0.01 by log-rank test. (C) Representative BLI (Day 125) and X-radiographs (Day 154) of mice from (B). Arrows point to osteolytic lesions. (D) Ectopic overexpression of VCAM-1 in CN34 as detected by western blot. (E) Kaplan-Meier curve of bone metastasis development of control and VCAM-1 overexpressing CN34 cells. N=10. *p < 0.05 by log-rank test. (F) Representative BLI (Day 125) and X-radiographs (Day 154) of mice from (E). Arrows point to osteolytic lesions. (G) Ectopic overexpression of VCAM-1 in MDA-MB-435 as detected by western blot. (H) Kaplan-Meier curve of bone metastasis development of control and VCAM-1-overexpressing MDA-MB-435 cells. N=10. *p < 0.05 by log-rank test. (I) Representative BLI (Day 42) of mice from (H).
Figure 4
Figure 4. Antibody therapy targeting VCAM-1 and integrin α4 inhibits bone metastasis
(A) BLI curves of bone metastasis development by PD2D cells in nude mice with control IgG or anti-VCAM-1 (clone P3C4) treatment started from Day 10. Data represent mean ± SEM. N=6. *p < 0.05 by Mann-Whitney test. (B) Representative BLI of mice treated with IgG or anti-VCAM-1 antibodies. (C) BLI curves of bone metastasis progression by PD2D cells with control IgG or anti-VCAM-1 treatment started from Day 62. BLI signals were normalized to Day 62 to facilitate comparison. Data represent mean ± SEM. N=6. *p < 0.05 by Mann-Whitney test. (D) BLI curves of bone metastasis development by PD2D cells with control IgG or anti-α4 (clone PS/2) treatment started from Day 0 until Day 21. Data represent mean ± SEM. N=10. **p < 0.01 by Mann-Whitney test. (E) Representative BLI of mice treated with IgG or anti-α4. (F) X-radiography of PD2D-injected mice treated with anti-VCAM-1 (A) or anti-α4 (D) at the end of experiments. Arrows point to osteolytic lesions. See also Figure S3.
Figure 5
Figure 5. VCAM-1 promotes osteoclast activation by direct interaction with pre-osteoclasts
(A) H&E and TRAP staining of hindlimb long bones showing tumor (T, demarcated by dotted line), bone (B) and TRAP+ (red) osteoclasts. Mice were injected with PD2D and samples were obtained from Figure 4F. Scale bar 100μm. (B) In vitro osteoclastogenesis of murine bone marrow co-cultured with different tumor cell monolayers. Mature osteoclasts were quantified as multinucleated TRAP+ (red) cells. Data represent mean ± SD. ***p < 0.001, #p > 0.5 by Student’s t-test and Mann-Whitney test. Scale bar 250μm. (C) RT-PCR showing α4β1 expression in RAW264.7 before as well as after induced differentiation, but not in osteoblast cell lines (MC3T3-E1 and 7F2). Murine bone marrow was used as positive control. (D) Surface expression of α4β1 by RAW264.7 revealed by FACS staining. Scale bar 25μm. (E) RANKL-induced RAW264.7 differentiation on pre-coated plates. Arrows indicate early formation of multinucleated cells. TRAP staining on Day 5 showed morphologically larger osteoclasts in VCAM-1-coated plate. Scale bar 100μm. (F) Expression pattern of known osteoclast differentiation markers in RAW264.7 cultured with or without VCAM-1-coating in the present or absence of RANKL induction. The markers, quantified by qRT-PCR, include known upregulated (Up) and downregulated (Down) genes during osteoclast differentiation. See also Figure S4.
Figure 6
Figure 6. VCAM-1-mediated attraction of osteoclast progenitors
(A) Chemotaxis of RAW264.7 to sVCAM-1 blocked by anti-VCAM-1 or anti-α4 antibodies. (B) Chemotaxis of RAW264.7 to tumor conditioned medium. In (A) and (B), data represent mean ± SD. ***p < 0.001 by Student’s t-test. (C) Scanning EM showing adhesion of RAW264.7 to PD2D but not to SCP6 or VCAM-1-silenced PD2D. (D) FACS of murine bone marrow showing α4+β1+ (P3) and α4 β1+ (P2) cells in CD45+CD11b+ monocytes (P1). Sorted P3, but not P2, differentiated into TRAP+ osteoclasts under induction. Scale bar 500μm. (E) FACS quantification of CD11b+ monocytes in CD45+ bone marrow leukocytes of mice injected with PD2D with or without bone metastases formed, as well as of age-matched mice without injection (control). (F) FACS quantification of α4+β1+ and α4 β1+ subpulations of CD11b+ monocytes in bone marrow of mice injected with PD2D with or without bone metastases formed. (G) FACS quantification of CD11b+ monocyte population in CD45+ peripheral blood leukocytes of mice injected with PD2D with or without bone metastases formed, as well as of age-matched mice with established PD2D primary tumors. In (E), (F) and (G), percentage was reported after excluding tumor cells (positive for human HLA-ABC), if they exist. Data represent mean ± SD. *p < 0.05, ***p < 0.001 by Student’s t-test. (H) Experimental flow of EviBoM. Green dots represent monocytes expressing CX3CR1-EGFP knock-in gene. (I) Representative EviBoM image frames and tracked movement of CX3CR1-EGFP+ monocytes with IgG or anti-VCAM-1 ex vivo treatment. Scale bar 30μm. (J) Comparison of median tracking velocity of CX3CR1-EGFP+ monocytes in (I). Black bar represents the median of all data. Student’s t-test. See also Figure S5, Movie S1 and Movie S2.
Figure 7
Figure 7. VCAM-1 upregulation is dependent on NFκB activity
(A) Dose-dependent inhibition of VCAM-1 expression by NFκB pathway inhibitors MG132 and helenalin as detected by western blot. (B) Inhibition of VCAM-1 expression by ectopic IκBαM expression as detected by western blot. (C) Differential abundance of nuclear RelA and cytoplasmic IκBα in SCP6 and VCAM-1+ PD cells as detected by western blot. (D) EMSA showing stronger band shift in PD1 and PD2D compared with SCP6. Wild type competitive probe (wt) and inhibitors MG132 and helenalin, but not mutated competitive probe (mut), blocked radioactive NFκB-specific probe binding. See also Figure S6.
Figure 8
Figure 8. VCAM-1 expression is associated with clinical early recurrence
(A) Bimodal pattern of metastasis relapse in a breast cancer cohort (Wang et al., 2005). Dotted line separates early and late relapse at 30-month, the peak of the curve. (B) VCAM-1 is expressed at higher level in the early compared with the late metastasis relapse group. Data represent mean ± SEM and are tested by Student’s t-test. (C) VCAM-1 expression correlates with early recurrence in a breast cancer TMA. Also shown are representative breast carcinoma TMA samples stained for VCAM-1. (D) A schematic model for the function of VCAM-1 in the transition from dormant micrometastasis to macrometastasis in bone. Incidental activation of VCAM-1, a process possibly dependent on NFκB signaling and other unidentified mechanism(s) (1), in micrometastasis arrests α4β1-positive osteoclast progenitors through paracrine chemotaxis (2) and adhesion (3). This leads to a localized increase of the osteoclast progenitor population and increased mature osteoclast activity (4). Activated osteoclasts resorb the bone and instigate the formation of bone metastasis vicious cycle (5).

Comment in

References

    1. Aguirre-Ghiso JA. Models, mechanisms and clinical evidence for cancer dormancy. Nat Rev Cancer. 2007;7:834–846. - PMC - PubMed
    1. Braun S, Vogl FD, Naume B, Janni W, Osborne MP, Coombes RC, Schlimok G, Diel IJ, Gerber B, Gebauer G, et al. A Pooled Analysis of Bone Marrow Micrometastasis in Breast Cancer. The New England Journal of Medicine. 2005;353:793–802. - PubMed
    1. Brown K, Gerstberger S, Carlson L, Franzoso G, Siebenlist U. Control of IkappaB-alpha Proteolysis by Site-Specific, Signal-Induced Phosphorylation. Science. 1995;267:1485–1488. - PubMed
    1. Carter RA, Wicks IP. Vascular cell adhesion molecule 1 (CD106): a multifaceted regulator of joint inflammation. Arthritis Rheum. 2001;44:985–994. - PubMed
    1. Chambers AF. MDA-MB-435 and M14 Cell Lines: Identical but not M14 Melanoma? Cancer Research. 2009;69:5292–5293. - PubMed

Publication types

MeSH terms

Associated data