

Cochlear-implant spatial selectivity with monopolar, bipolar and tripolar stimulation
- PMID: 22138630
- PMCID: PMC3277661
- DOI: 10.1016/j.heares.2011.11.005
Cochlear-implant spatial selectivity with monopolar, bipolar and tripolar stimulation
Abstract
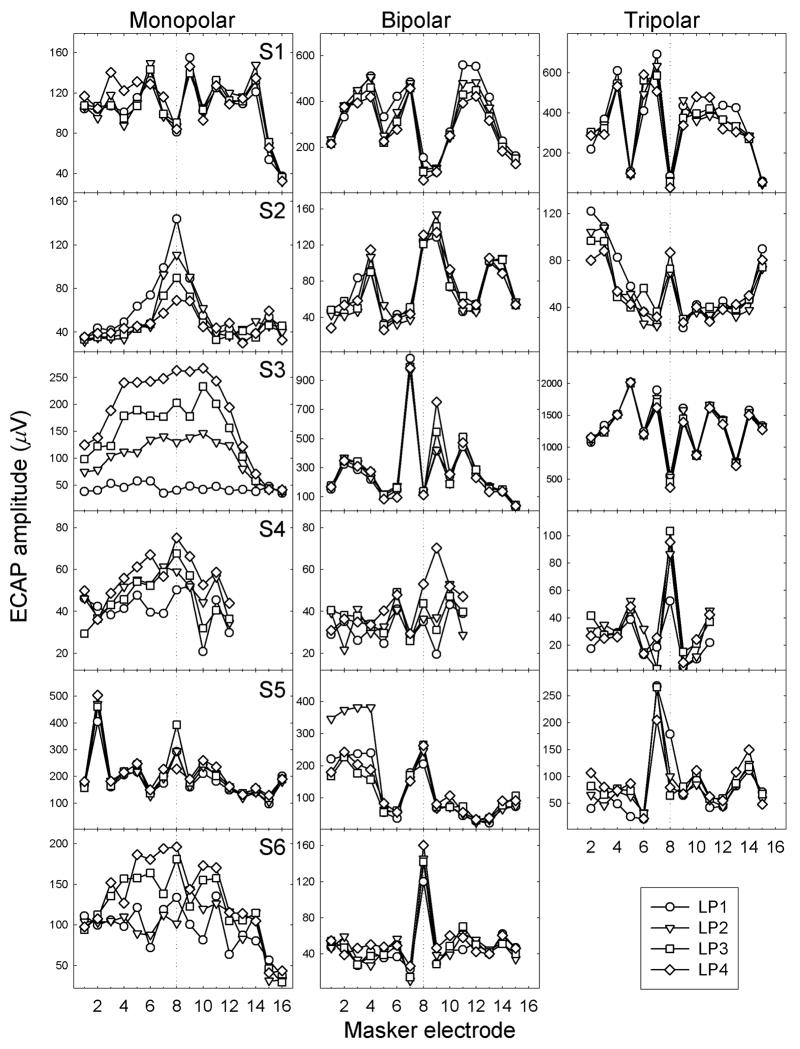
Sharp spatial selectivity is critical to auditory performance, particularly in pitch-related tasks. Most contemporary cochlear implants have employed monopolar stimulation that produces broad electric fields, which presumably contribute to poor pitch and pitch-related performance by implant users. Bipolar or tripolar stimulation can generate focused electric fields but requires higher current to reach threshold and, more interestingly, has not produced any apparent improvement in cochlear-implant performance. The present study addressed this dilemma by measuring psychophysical and physiological spatial selectivity with both broad and focused stimulations in the same cohort of subjects. Different current levels were adjusted by systematically measuring loudness growth for each stimulus, each stimulation mode, and in each subject. Both psychophysical and physiological measures showed that, although focused stimulation produced significantly sharper spatial tuning than monopolar stimulation, it could shift the tuning position or even split the tuning tips. The altered tuning with focused stimulation is interpreted as a result of poor electrode-to-neuron interface in the cochlea, and is suggested to be mainly responsible for the lack of consistent improvement in implant performance. A linear model could satisfactorily quantify the psychophysical and physiological data and derive the tuning width. Significant correlation was found between the individual physiological and psychophysical tuning widths, and the correlation was improved by log-linearly transforming the physiological data to predict the psychophysical data. Because the physiological measure took only one-tenth of the time of the psychophysical measure, the present model is of high clinical significance in terms of predicting and improving cochlear-implant performance.
Copyright © 2011 Elsevier B.V. All rights reserved.
Figures


Similar articles
-
Spatial tuning curves from apical, middle, and basal electrodes in cochlear implant users.J Acoust Soc Am. 2011 Jun;129(6):3916-33. doi: 10.1121/1.3583503. J Acoust Soc Am. 2011. PMID: 21682414 Free PMC article.
-
Identifying cochlear implant channels with poor electrode-neuron interface: partial tripolar, single-channel thresholds and psychophysical tuning curves.Ear Hear. 2010 Apr;31(2):247-58. doi: 10.1097/AUD.0b013e3181c7daf4. Ear Hear. 2010. PMID: 20090533 Free PMC article.
-
Current focusing sharpens local peaks of excitation in cochlear implant stimulation.Hear Res. 2010 Dec 1;270(1-2):89-100. doi: 10.1016/j.heares.2010.09.004. Epub 2010 Sep 17. Hear Res. 2010. PMID: 20850513 Free PMC article.
-
Cochlear infrastructure for electrical hearing.Hear Res. 2011 Nov;281(1-2):65-73. doi: 10.1016/j.heares.2011.05.002. Epub 2011 May 14. Hear Res. 2011. PMID: 21605648 Free PMC article. Review.
-
Probing the electrode-neuron interface with focused cochlear implant stimulation.Trends Amplif. 2010 Jun;14(2):84-95. doi: 10.1177/1084713810375249. Trends Amplif. 2010. PMID: 20724356 Free PMC article. Review.
Cited by
-
Current distribution of distributed all-polar cochlear implant stimulation mode measured in-situ.PLoS One. 2022 Oct 31;17(10):e0275961. doi: 10.1371/journal.pone.0275961. eCollection 2022. PLoS One. 2022. PMID: 36315506 Free PMC article.
-
What Is the Benefit of Ramped Pulse Shapes for Activating Auditory Cortex Neurons? An Electrophysiological Study in an Animal Model of Cochlear Implant.Brain Sci. 2023 Jan 31;13(2):250. doi: 10.3390/brainsci13020250. Brain Sci. 2023. PMID: 36831793 Free PMC article.
-
Auditory brainstem stimulation with a conformable microfabricated array elicits responses with tonotopically organized components.Hear Res. 2019 Jun;377:339-352. doi: 10.1016/j.heares.2019.02.010. Epub 2019 Feb 26. Hear Res. 2019. PMID: 30867111 Free PMC article.
-
Use of Research Interfaces for Psychophysical Studies With Cochlear-Implant Users.Trends Hear. 2017 Jan-Dec;21:2331216517736464. doi: 10.1177/2331216517736464. Trends Hear. 2017. PMID: 29113579 Free PMC article. Review.
-
Electrical equivalent circuit for analyzing the effect of signal shape on power distribution in cochlear implant electrodes and surrounding tissue.Sci Rep. 2025 Jun 20;15(1):20136. doi: 10.1038/s41598-025-04840-5. Sci Rep. 2025. PMID: 40541999 Free PMC article.
References
-
- Abbas PJ, Hughes ML, Brown CJ, Miller CA, South H. Channel interaction incochlear implant users evaluated using the electrically evoked compound action potential. Audiol Neurootol. 2004;9:203–213. - PubMed
-
- Abbas PJ, Brown CJ, Shallop JK, Firszt JB, Hughes ML, Hong SH, Staller SJ. Summary of results using the nucleus CI24M implant to record the electrically evoked compound action potential. Ear Hear. 1999;20:45–59. - PubMed
-
- Bekesy G. Direct observation of the vibrations of the cochlear partition under a microscope. Acta Otolaryngol. 1952;42:197–201. - PubMed
-
- Berenstein CK, Mens LH, Mulder JJ, Vanpoucke FJ. Current steering and current focusing in cochlear implants: comparison of monopolar, tripolar, and virtual channel electrode configurations. Ear Hear. 2008;29:250–260. - PubMed
-
- Berenstein CK, Vanpoucke FJ, Mulder JJ, Mens LH. Electrical field imaging as a means to predict the loudness of monopolar and tripolar stimuli in cochlear implant patients. Hear Res. 2010;270:28–38. - PubMed
Publication types
MeSH terms
Grants and funding
LinkOut - more resources
Full Text Sources
Other Literature Sources
Medical
