. 2011 Dec 4;15(1):29-38.
doi: 10.1038/nn.2979.

miR-124 acts through CoREST to control onset of Sema3A sensitivity in navigating retinal growth cones

Affiliations

miR-124 acts through CoREST to control onset of Sema3A sensitivity in navigating retinal growth cones

Marie-Laure Baudet et al. Nat Neurosci. .

Abstract

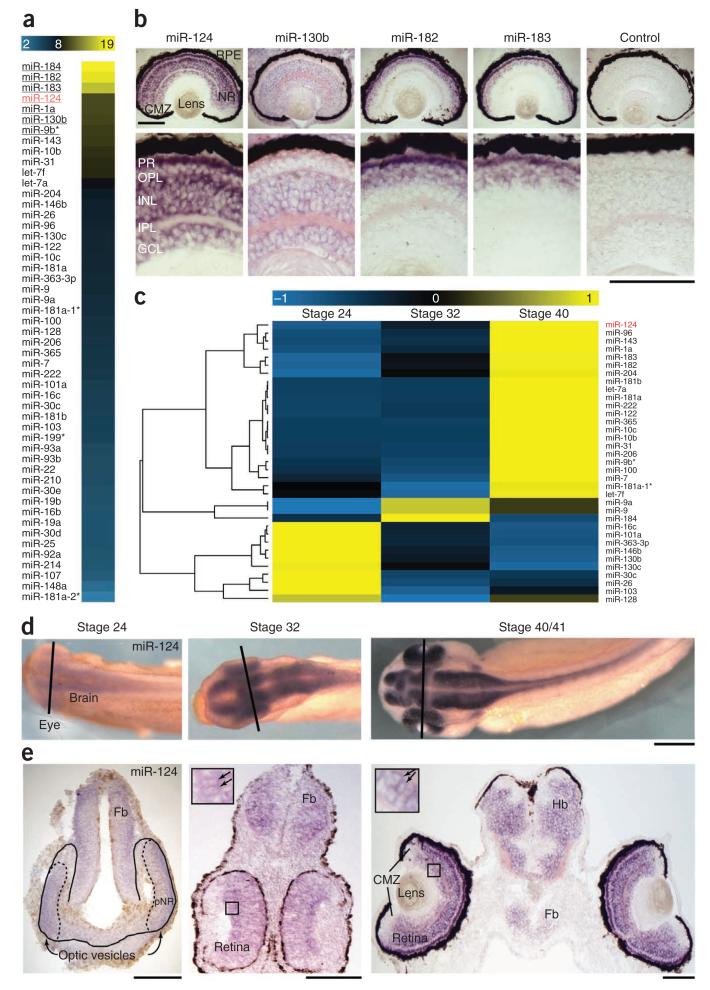
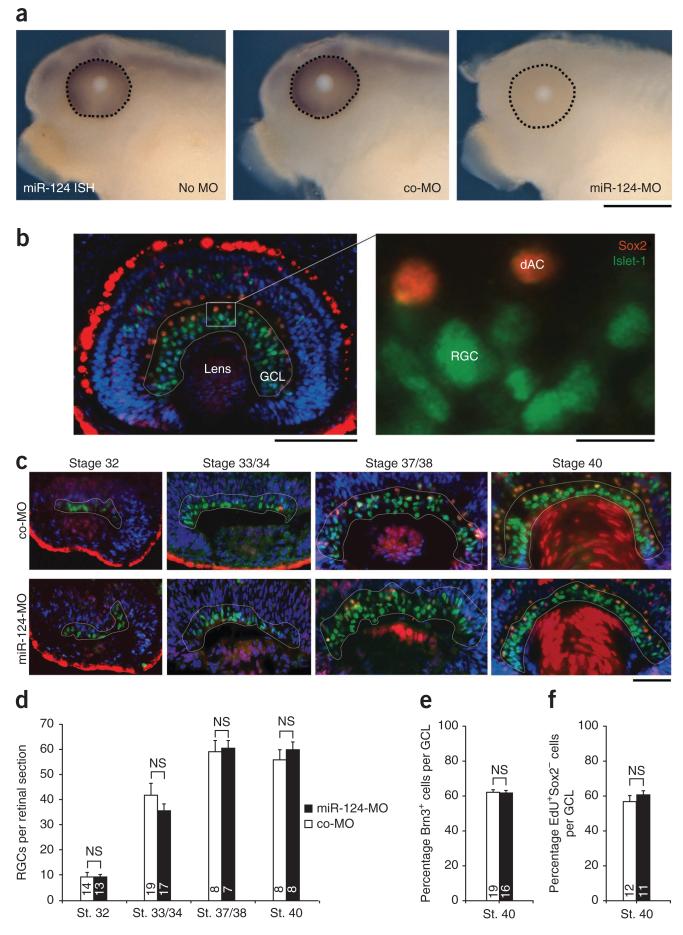
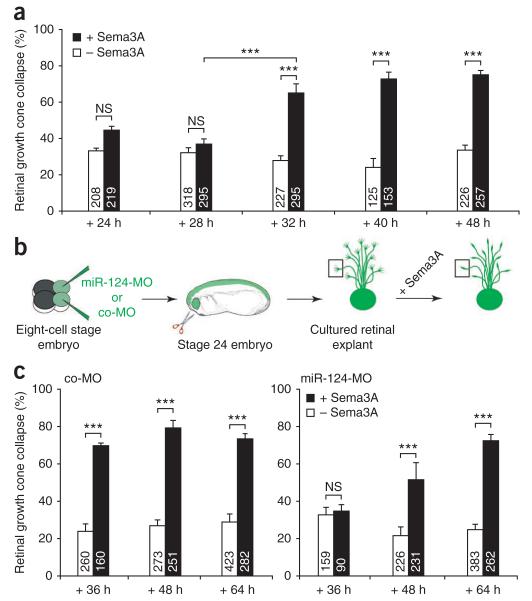
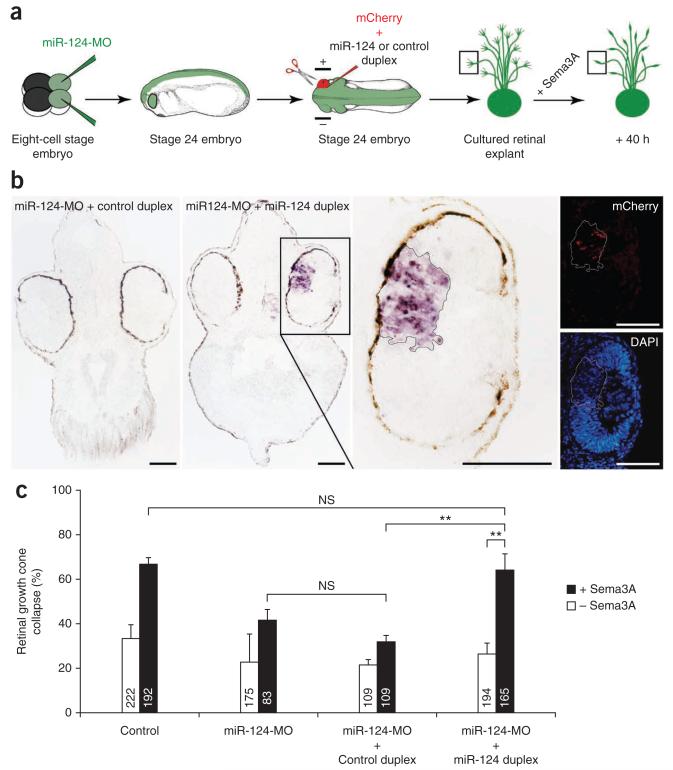
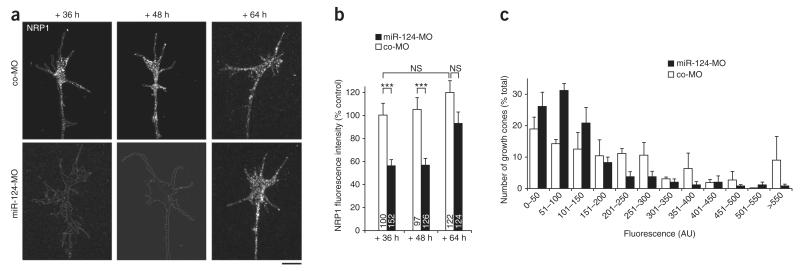
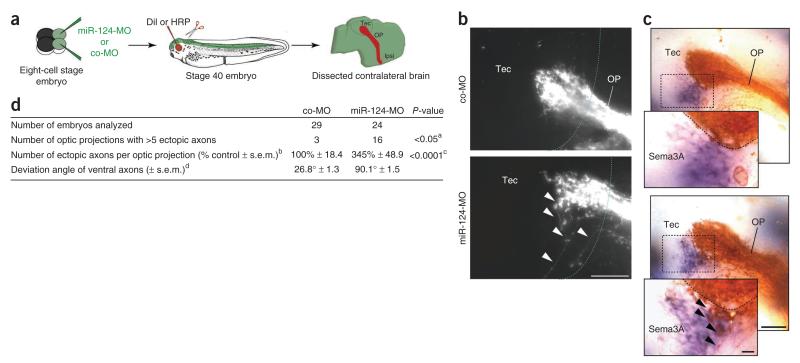
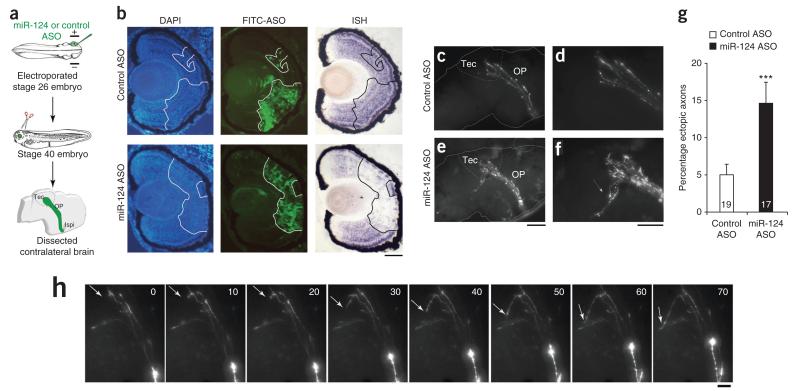
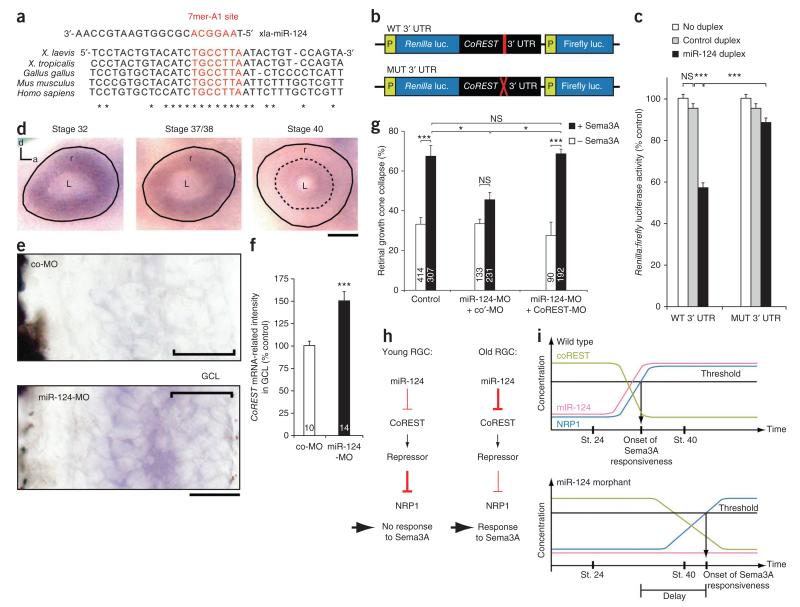
During axon pathfinding, growth cones commonly show changes in sensitivity to guidance cues that follow a cell-intrinsic timetable. The cellular timer mechanisms that regulate such changes are, however, poorly understood. Here we have investigated microRNAs (miRNAs) in the timing control of sensitivity to the semaphorin Sema3A in Xenopus laevis retinal ganglion cell (RGC) growth cones. A developmental profiling screen identified miR-124 as a candidate timer. Loss of miR-124 delayed the onset of Sema3A sensitivity and concomitant neuropilin-1 (NRP1) receptor expression and caused cell-autonomous pathfinding errors. CoREST, a cofactor of a NRP1 repressor, was newly identified as a target and mediator of miR-124 for this highly specific temporal aspect of RGC growth cone responsiveness. Our findings indicate that miR-124 is important in regulating the intrinsic temporal changes in RGC growth cone sensitivity and suggest that miRNAs may act broadly as linear timers in vertebrate neuronal development.


Figures

Figure 1
Figure 1
Expression profiling of miRNAs in the developing retina. (a) Heat map representing the log2 of the normalized number of reads for the 51 miRNAs profiled in stage 40 retina (neural retina and retinal pigmented epithelium) using Illumina sequencing. The names of miRNAs with >1,000 reads are underlined. (b) Retinal distribution of the most abundant miRNAs at stage 40 by ISH. Only miR-124 and miR-130b are distributed in RGCs, along with other retinal cells, whereas miR-182 and miR-183 are located in the developing photoreceptor layers. (c) Hierarchical clustering of the 35 miRNAs detected with >50 reads at any of the stages studied. The heat map shows the relative standardized miRNA expression (Z-score) indicated in the color key. There were 10, 22 and 3 miRNAs that appeared, respectively, to decrease over time, increase over time or peak at stage 32. (d,e) ISH on whole mounts (d) or tissue sections (e) showing miR-124 detection in the spinal cord, brain and retina of Xenopus embryos, including in differentiating RGCs (arrows in insets). Lines in d indicate approximate planes of section shown below in e; boxed regions in e are magnified in insets. miR-124 was absent or low in proliferating cells and in the ciliary marginal zone (CMZ). Fb, forebrain; GCL, ganglion cell layer; Hb, hindbrain; INL, inner nuclear layer; IPL, inner plexiform layer; OPL, outer plexiform layer; PR, photoreceptor layer; NR, neural retina; pNR, presumptive NR (dashed outline) within optic vesicles (solid outline); RPE, retinal pigmented epithelium. Scale bars, 100 μm (b,e); 250 μm (d).
Figure 2
Figure 2
miR-124 knockdown does not affect the timing of RGC genesis and differentiation. (a) Morpholino-mediated knockdown of endogenous miR-124 was confirmed at stage 40 by whole-mount ISH. No signal was detected in embryos injected with miR-124-MO, unlike in controls (uninjected or co-MO injected). (b) Representative stage 40 retina stained with Islet-1 (green), Sox2 (red) and DAPI (blue). The white outline delineates the developing RGC layer. A cell was considered a RGC when it was located in the innermost part of the retina, positive for Islet-1 and negative for Sox2. dAC, displaced amacrine cell. (c) Illustrative retinas stained for Islet-1 and Sox2 from stage 32–40 embryos microinjected with co-MO or miR-124-MO. (d) Numbers of RGCs per retinal section in stage (st.) 32–40 retina of embryos injected with co-MO or miR-124-MO. (e,f) Proportion of Brn3-positive cells (e) and EdU-positive, Sox2-negative cells (f) per GCL of embryos injected with co-MO or miR-124-MO. All samples passed Kolmogorov-Smirnov normality test. (d) Analysis of variance (ANOVA) followed by Bonferroni post-test. (e,f) Unpaired Student’s t-test. Values are mean ± s.e.m. NS, not significant. Numbers of retinas analyzed are indicated in bars. Up to ten 12-μm sections were analyzed per retina; about 25,000 (d), 20,000 (e) and 8,000 (f) cells were counted in total. Scale bars, 250 μm (a); 100 μm (b, left), 10 μm (b, right); 50 μm (c).
Figure 3
Figure 3
Responsiveness of growth cones to Sema3A is delayed in miR-124 morphants. (a) Measure of the number of collapsed growth cones in stage 24 retinal explants grown in culture for 24–48 h in the presence (+) or absence (−) of Sema3A. The onset of retinal growth cone responsiveness to Sema3A occurred between 28 and 32 h in culture by collapse assay. (b) Schematic representation of the experiment; 125 μM co-MO or miR-124-MO were injected. Collapsed growth cones (box) have retracted lamellipodia and have less than two filopodia. (c) Number of collapsed growth cones in stage 24 retinal explants dissected from embryos injected with either co-MO or miR-124-MO and grown in culture for 36–64 h. Growth cone responsiveness to Sema3A was delayed in miR-124 morphants compared to control. All samples passed Kolmogorov-Smirnov normality test. ANOVA followed by Bonferroni post-test. Values are mean ± s.e.m.; NS, not significant; ***P < 0.001. Number of growth cones analyzed are indicated in bars. Stage 24 embryo image in b modified from ref. 46, copyright 1994 P.D. Nieuwkoop and J. Faber. Reproduced by permission of Taylor and Francis Group, LLC, a division of Informa plc.
Figure 4
Figure 4
Electroporated miR-124 duplex rescues normal onset of Sema3A response. (a) Schematic representation of the experiment and illustrative collapsed growth cone (box). Positive and negative electrodes are shown. We electroporated 50 μM miR-124 or control duplexes, along with 400 ng μl−1 CAAX-mCherry to assess the electroporation success. (b) ISH of stage 37/38 Xenopus head sections. Exogenous miR-124 duplex, but not control duplex, was detected in electroporated retinal areas (delineated by a solid black (brightfield image) or white (fluorescence images) line) in a miR-124 morphant background. The decrease in fluorescent DAPI signal is likely due to a masking effect of the ISH BM Purple precipitate. (c) Number of collapsed growth cones in stage 24 retinal explants grown in culture for 40 h. Growth cone responsiveness to Sema3A was restored to control levels in miR-124 morphants electroporated with miR-124 duplex but not with control duplex. All samples passed Kolmogorov-Smirnov normality test. ANOVA followed by Bonferroni post-test. Values are mean ± s.e.m.; NS, not significant; **P < 0.01. Number of growth cones analyzed are indicated in bars. Scale bars, 100 μm. Stage 24 embryo images in a modified from ref. 46, copyright 1994 P.D. Nieuwkoop and J. Faber. Reproduced by permission of Taylor and Francis Group, LLC, a division of Informa plc.
Figure 5
Figure 5
Expression of NRP1 in growth cones is delayed in miR-124 morphants. (a) Illustrative growth cones stained for NRP1; the white lines delineate the boundaries of the growth cone and the distal axon shaft. Contrast and brightness were both increased for illustration purposes. Scale bar, 10 μm. (b) Fluorescence intensity associated with NRP1 immunostaining measured in growth cones from stage 24 explants grown in culture for 36–64 h. The fluorescence intensity was lower in retinal growth cones from miR-124 morphants than in controls after 36 and 48 h in culture but not after 64 h. Kruskal-Wallis test followed by Dunn post-test. Values are mean ± s.e.m.; NS, not significant; ***P < 0.001. Numbers of growth cones analyzed are indicated in bars. (c) Distribution of growth cone NRP1 fluorescence intensity from stage 24 explants grown in culture for 48 h. AU, arbitrary units.
Figure 6
Figure 6
RGC axons are misrouted in the ventral tectum in miR-124 morphants. (a) Schematic representation of the experiment. We microinjected 125 μM co-MO or miR-124-MO. (b) DiI-labeled RGC axons visualized in the contralateral brain (lateral view). The dotted blue line represents the anterior boundary of the tectum. (c) HRP-labeled RGC axons (brown) visualized along with Sema3A mRNA (purple). The black dotted line delineates the ventral tectal boundary of the optic projection. In brains from miR-124 morphant embryos (b,c, bottom), a subset of ventral axons (arrowheads) adjacent to a tectal site of Sema3A production failed to stop and appeared misrouted toward the ventral part of tectum. (d) Quantitative analysis of the phenotype. aFisher exact test. A conservative cut-off value (>5 aberrantly targeting axons) was chosen to determine whether a given OP was considered abnormal. bValues were normalized to the width of the OP at the anterior boundary of the tectum to account for variation in DiI filling. cUnpaired Mann-Whitney U test. dDeviation angles formed by the 5–8 most ventral axons (co-MO) and ventral ectopic axons (miR-124-MO) to the median axon of the OP (see also Supplementary Fig. 6). We counted 213 ectopic axons in total, and the angles formed by 337 axons were measured in total. Images were adjusted for brightness and contrast. HRP, horseradish peroxidase; Ipsi, ipsilateral; OP, optic projection; Tec, tectum. Scale bars, 50 μm (b,c); inset (c), 10 μm. Stage 40 embryo image in a modified from ref. 46, copyright 1994 P.D. Nieuwkoop and J. Faber. Reproduced by permission of Taylor and Francis Group, LLC, a division of Informa plc.
Figure 7
Figure 7
miR-124 acts autonomously to cause retinal axon misrouting (a) Schematic representation of the experiment. ASOs (100 μM morpholino or 18.75 μM LNA knockdown probe) were electroporated. (b) ISH performed on embryos electroporated with fluorescein isothiocyanate (FITC)-labeled morpholino and fixed at stage 40. Cells electroporated with miR-124 ASO were devoid of endogenous miR-124–associated signal, whereas controls showed a strong miR-124–associated signal throughout the retina, even in electroporated cells. (c–f) Fluorescing RGC axons projecting to the contralateral brain (c,e), with corresponding zoomed images (d,f). A subpopulation of axons from RGCs, electroporated with miR-124 ASO, did not stop in the tectum but misprojected ventrally (e,f, arrow), whereas RGC axons all stopped in the tectum in controls (c,d). (g) Number of ectopic axons normalized to the number electroporated RGC axons in the tectum. Unpaired Mann-Whitney U test. Values are mean ± s.e.m., ***P < 0.001. Numbers of optic projections examined are indicated in bars; 556 axons were analyzed in total. (h) Time-lapse imaging of axons misprojecting in the ventral tectum. After reaching the tectum, an axon took a sharp, 90° turn and was misrouted in a distal-ventral direction, instead of stopping and branching within the tectum (arrow). Time is shown in minutes. Images were adjusted for brightness and contrast. Ipsi, ipsilateral; OP, optic projection; Tec, tectum. Scale bars, 50 μm (b); 100 μm (c,e); 50 μm (d,f); 20 μm (h). Embryo images in a modified from ref. 46, copyright 1994 P.D. Nieuwkoop and J. Faber. Reproduced by permission of Taylor and Francis Group, LLC, a division of Informa plc.
Figure 8
Figure 8
CoREST mediates miR-124 action on Sema3A responsiveness. (a) Sequence alignment of the 3′ UTR of CoREST from various species. (b) Schematic representation of Xenopus CoREST 3′ UTR, with wild-type (WT) or mutated (MUT) miR-124 binding site, subcloned downstream of a dual Renilla:firefly luciferase (luc.) reporter. (c) Quantification of reporter activity after transfection of 1–5 pmol Xenopus miR-124 or control duplex in HEK (human embryonic kidney)-293T cells. (d) Ocular distribution of CoREST mRNA detected by ISH. Solid black line delineates the outer boundary of the retina and the dashed line demarcates the peripheral area devoid of staining. (e) Retinal CoREST mRNA distribution in stage 40 embryos injected with 125 μM co-MO or miR-124-MO. (f) Quantification of CoREST mRNA signal intensity in the GCL. (g) Number of collapsed growth cones in stage 24 retinal explants grown in culture for 40 h after microinjection of 25 μM (1.1 ng) CoREST-MO, standard commercially available control morpholino (co′-MO) and/or 125 μM miR-124-MO. (h,i) Model of miR-124-mediated regulation of growth cone aging (see text for explanation). Statistics: (c,g) All samples passed Kolmogorov-Smirnov normality test. ANOVA followed by Bonferroni post-test. (f) Unpaired Mann-Whitney U test. Values are mean ± s.e.m. throughout figure; NS, not significant; *P < 0.05, ***P < 0.001. Numbers in bars indicate number of retinas examined (f; up to seven 18-μm sections were analyzed per retina) or number of growth cones analyzed (g). a, anterior; d, dorsal; L, lens; P, promoter; r, retina; xla, Xenopus laevis. Scale bars, 100 μm (d), 25 μm (e).

References

    1. Tessier-Lavigne M, Goodman CS. The molecular biology of axon guidance. Science. 1996;274:1123–1133. - PubMed
    1. Dickson BJ. Molecular mechanisms of axon guidance. Science. 2002;298:1959–1964. - PubMed
    1. Zou Y, Stoeckli E, Chen H, Tessier-Lavigne M. Squeezing axons out of the gray matter: a role for slit and semaphorin proteins from midline and ventral spinal cord. Cell. 2000;102:363–375. - PubMed
    1. Stein E, Tessier-Lavigne M. Hierarchical organization of guidance receptors: silencing of netrin attraction by slit through a Robo/DCC receptor complex. Science. 2001;291:1928–1938. - PubMed
    1. Shewan D, Dwivedy A, Anderson R, Holt CE. Age-related changes underlie switch in netrin-1 responsiveness as growth cones advance along visual pathway. Nat. Neurosci. 2002;5:955–962. - PubMed

Publication types

Associated data