. 2011 Dec 4;44(1):23-31.
doi: 10.1038/ng.1009.

Dnmt3a is essential for hematopoietic stem cell differentiation

Affiliations

Dnmt3a is essential for hematopoietic stem cell differentiation

Grant A Challen et al. Nat Genet. .

Abstract

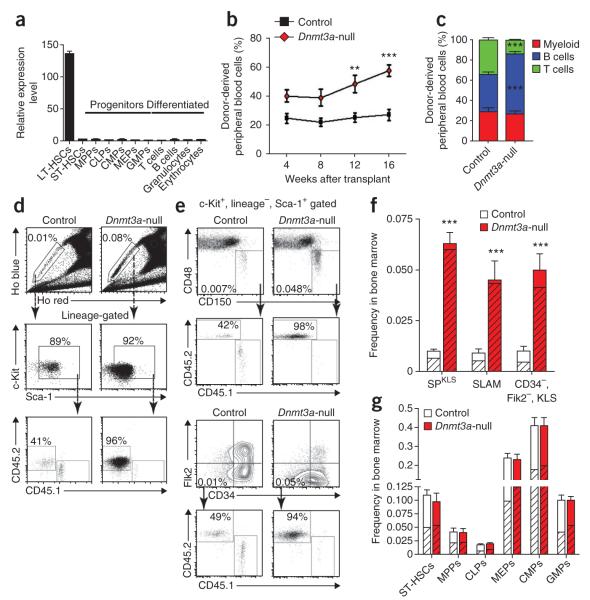
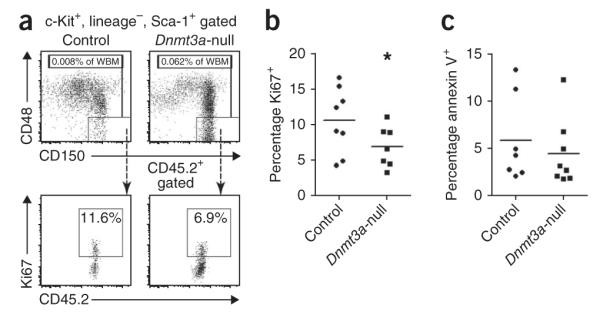
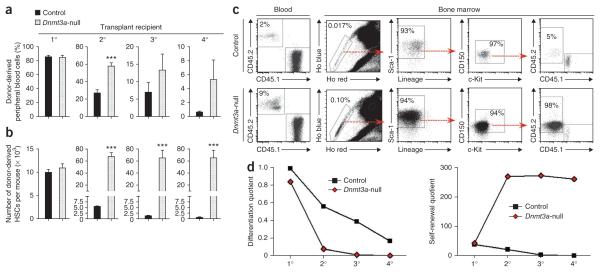
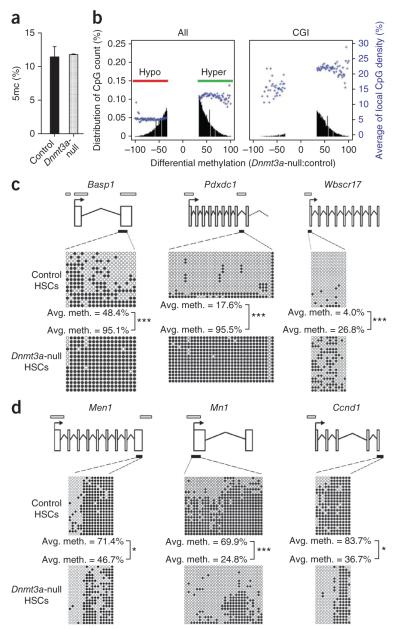
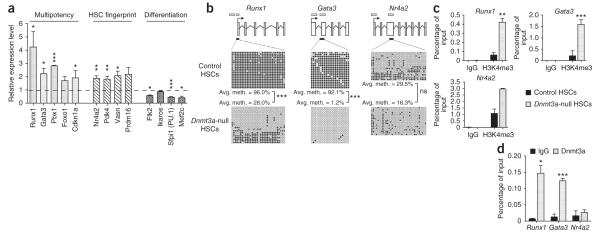
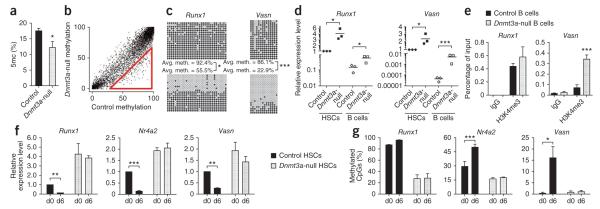
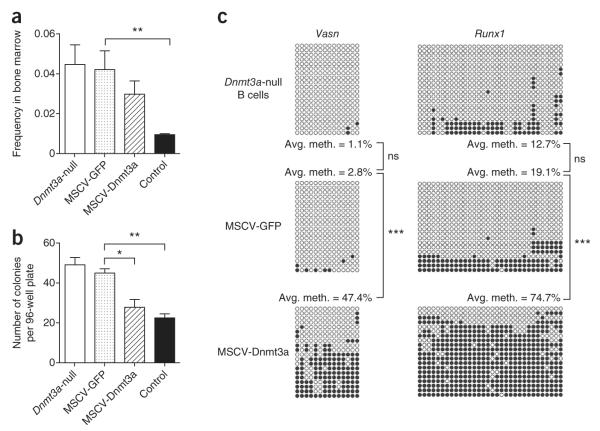
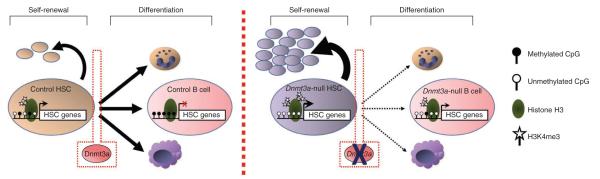
Loss of the de novo DNA methyltransferases Dnmt3a and Dnmt3b in embryonic stem cells obstructs differentiation; however, the role of these enzymes in somatic stem cells is largely unknown. Using conditional ablation, we show that Dnmt3a loss progressively impairs hematopoietic stem cell (HSC) differentiation over serial transplantation, while simultaneously expanding HSC numbers in the bone marrow. Dnmt3a-null HSCs show both increased and decreased methylation at distinct loci, including substantial CpG island hypermethylation. Dnmt3a-null HSCs upregulate HSC multipotency genes and downregulate differentiation factors, and their progeny exhibit global hypomethylation and incomplete repression of HSC-specific genes. These data establish Dnmt3a as a critical participant in the epigenetic silencing of HSC regulatory genes, thereby enabling efficient differentiation.


Figures

Figure 1
Figure 1
Dnmt3a is highly expressed in HSCs and its ablation has profound functional effects. (a) Real-time PCR analysis of Dnmt3a mRNA in LT-HSCs, short-term HSCs (ST-HSCs) and representative committed progenitors and differentiated cells. MPPs, multi-potential progenitors; CLPs, common lymphoid progenitors; CMPs, common myeloid progenitors; MEPs, megakaryocyte-erythroid progenitors; GMPs, granulocyte-macrophage progenitors (see Online Methods for purification schemes). Mean ± s.e.m. values are shown for three biological replicates. (b) Contribution of control (Dnmt3afl/fl;Mx1-Cre) and Dnmt3a-null (Dnmt3afl/fl;Mx1-Cre+) HSCs to recipient mouse peripheral blood in secondary competitive transplants, measured at monthly intervals. Mean ± s.e.m. values are shown. (c) Lineage differentiation in secondary recipients of transplanted control and Dnmt3a-null HSCs. Shown are percentages of donor-derived (CD45.2+) myeloid cells (Gr1+ or Mac1+), B cells (B220+) and T cells (CD4+ or CD8+) in peripheral blood analyzed 16 weeks after transplantation. Differences that are significant between control and Dnmt3a-null HSCs are indicated. Mean ± s.e.m. values are shown (N = 15–37 mice). (d) Hoechst staining and flow cytometry analysis of the bone marrow of secondary recipient mice. Top, the boxed region shows the percentage of side population (SP) cells from mice transplanted with HSCs of the indicated genotypes. Bottom, SP cells were further gated using c-Kit+, lineage and Sca-1+ (KLS) markers to reveal the proportion of test (CD45.2+) versus competitor (CD45.1+) HSCs. (e) Alternative HSC phenotype schemes for test cells gated first by KLS show similar expansion of the Dnmt3a-null HSC compartment. (f) Quantification of total HSC frequency in the bone marrow of secondary recipient mice by three phenotypic definitions. Hatched area indicates the proportion of CD45.2+ test cells. SLAM is CD150+, CD48, KLS gating. Mean ± s.e.m. values are shown. (g) Analysis of progenitor frequencies in secondary recipient mice. Hatched area indicates the contribution of CD45.2+ test cells. Mean ± s.e.m. values are shown. **P < 0.001; ***P < 0.001.
Figure 2
Figure 2
Cellular kinetics of Dnmt3a-null HSCs. (a) HSC gating scheme for the analysis of proliferation and apoptosis in secondary recipient mice transplanted with control or Dnmt3a-null HSCs. (b) Ki67 staining shows a significant reduction in the proliferative index of Dnmt3a-null HSCs relative to control HSCs; *P < 0.05. (c) Annexin V staining shows no difference in the apoptotic rate between control and Dnmt3a-null HSCs. Bars in b and c indicate the mean values for each genotype.
Figure 3
Figure 3
Dnmt3a-null HSCs show inhibition of long-term differentiation in serial competitive transplantation of HSCs. (a) The proportion of peripheral blood generated from the test cells in recipient mice 16 weeks after transplantation. (b) Quantification of donor-derived HSCs in the bone marrow of recipient mice 18 weeks after transplantation, defined as CD45.2+, SPKLS cells. Data are representative of at least three individual transplantation experiments for each stage of serial transfer (N = 15–37 mice per group). Mean ± s.e.m. values are shown. (c) Flow cytometry data of quaternary recipient mice transplanted with control or Dnmt3a-null HSCs showing virtually all continuously amplified HSCs in bone marrow were derived from Dnmt3a-null HSCs (CD45.2+). (d) Differentiation and self-renewal quotients, calculated at the end of each round of transplantation with Dnmt3a-null and control HSCs. ***P < 0.001.
Figure 4
Figure 4
Dnmt3a loss in HSCs results in both hyper- and hypomethylation. (a) HPLC-MS analysis of global 5mc levels as a proportion of the total cytosine in purified HSCs from secondary recipient mice (N = 2). (b) RRBS analysis of tertiary recipient mice transplanted with control or Dnmt3a-null HSCs. Plots show the degree of differential methylation (between Dnmt3a-null and control HSCs) and its relationship to local CpG density (blue). Left, all hypomethylated (red, CpGs ≤33% methylated) and hypermethylated (green, CpGs ≥33% methylated) DMCs in Dnmt3a-null HSCs. Right, DMCs located within CGIs. (c) Independent bisulfite sequencing analysis of selected hypermethylated CGIs in Dnmt3a-null HSCs. (d) Bisulfite sequencing analysis of selected hypomethylated genes in Dnmt3a-null HSCs. Schematic diagrams for each gene are shown in c and d (not to scale). Exons are represented by vertical rectangles. White horizontal bars indicate CGIs, and black horizontal bars show the tested region. Open and filled circles represent unmethylated and methylated CpGs, respectively. Differences in methylation between control and Dnmt3a-null cells that were statistically significant are indicated; *P < 0.05, ***P < 0.001.
Figure 5
Figure 5
Dnmt3a loss in HSCs leads to higher expression of HSC multipotency genes. (a) Relative expression levels of select multipotency, HSC fingerprint and differentiation genes measured by real-time PCR analysis. Mean ± s.e.m. values are from three replicates in Dnmt3a-null HSCs normalized to the expression levels in control HSCs (dashed line). (b) Bisulfite sequencing analysis of multipotency and HSC fingerprint genes in control and Dnmt3a-null HSCs. Open horizontal bars indicate CGIs, and black horizontal bars show the tested region. Open and filled circles represent unmethylated and methylated CpGs, respectively. Differences in methylation between control and Dnmt3a-null HSCs that were statistically significant are indicated. (c) H3K4me3 ChIP analysis of DMRs in control and Dnmt3a-null HSCs. Mean ± s.e.m. values are shown (N = 3 replicate experiments). (d) Dnmt3a ChIP analysis of DMRs in wild-type hematopoietic progenitors (KLS cells, N = 2 replicate experiments) reveals Dnmt3a binding to CGIs in Runx1 and Gata3 but not in Nr4a2. Mean ± s.e.m. values are shown. *P < 0.05, **P < 0.01, ***P < 0.001.
Figure 6
Figure 6
Dnmt3a is required to suppress the stem cell program in HSCs to permit differentiation. (a) HPLC-MS analysis of global 5mc levels as a proportion of the total cytosine in B cells from secondary recipient mice. Mean ± s.e.m. values are shown (N = 7 mice). (b) DREAM analysis of B cells in secondary recipient mice. SmaI sites with at least 20 sequence tags in control B cells are plotted showing the methylation ratio between the genotypes. The red triangle indicates sites of hypomethylation in Dnmt3a-null B cells in 1.4% of all CpGs (FDR = 0.07%). (c) Bisulfite sequencing across the Vasn and Runx1 CGIs in control (top) and Dnmt3a-null (bottom) B cells. Differences in methylation between control and Dnmt3a-null cells that were statistically significant are indicated. (d) Cognate gene expression for cells analyzed in c. Diamonds indicate control cells, and squares indicate Dntm3a-null cells. HSCs are represented by filled symbols and B cells by open symbols. Bars indicate the average gene expression for each cell population. Differences in expression between control and Dnmt3a-null cells that were statistically significant are indicated. (e) H3K4me3 ChIP analysis for Runx1 and Vasn in control and Dnmt3a-null B cells. Mean ± s.e.m. values are shown (N = 4 replicate experiments). (f) Expression of Dnmt3a-responsive genes at day 0 (d0) and day 6 (d6) after 5-FU exposure measured by real-time PCR. Expression levels are relative to normalized expression of that gene in d0 control HSCs. Mean ± s.e.m. values are shown, and statistically significant differences in expression at the two time points are indicated. (g) Proportion of methylated CpGs as detected by bisulfite sequencing across CGIs. Mean ± s.e.m. values are shown for three biological replicates, and statistically significant differences in methylation at the two time points are indicated. *P < 0.05, **P < 0.01, ***P < 0.001.
Figure 7
Figure 7
Exogenous Dnmt3a partially restores function and methylation patterns. (a) Analysis of HSC (CD150+, CD48, KLS gated) frequency 18-weeks after transplantation. Sca-1+ cells from secondary recipient mice transplanted with Dnmt3a-null HSCs were transduced with either MSCV-Dnmt3a or control (MSCV-GFP) retroviruses and transplanted into tertiary recipients. Also shown are HSC frequencies in tertiary recipients transplanted with non-transduced control or Dnmt3a-null HSCs. Mean ± s.e.m. values are shown (N = 7–12 mice), and statistically significant differences are indicated. (b) Colony-forming capacity of Dnmt3a-null HSCs transduced with MSCV-GFP or MSCV-Dnmt3a. Also shown are colony formation from non-transduced control and Dnmt3a-null HSCs after the third serial transplantation. Mean ± s.e.m. values are shown (N = 4 replicate plates), and statistically significant differences are indicated. (c) Bisulfite sequencing in B cells across Vasn and Runx1 CGIs after forced exogenous Dnmt3a expression in Dnmt3a-null HSCs. Statistically significant differences in methylation are indicated. *P < 0.05, **P < 0.01, ***P < 0.001.
Figure 8
Figure 8
Model for Dnmt3a action in HSCs. HSC-specific genes are mostly unmethylated and expressed in normal HSCs (left). Upon receiving a signal to differentiate, Dnmt3a methylates and silences these regions to permit lineage commitment. This is associated with a loss of H3K4me3 and gene repression in B cells. Dnmt3a-null HSCs (right) cannot silence HSC genes, so upon receiving a stimulus to differentiate, HSC-specific genes remain expressed due to a lack of methylation and elevated H3K4me3. Upon cell division, the HSC self-renewal pathway remains active in Dnmt3a-null HSCs, resulting in their accumulation in the bone marrow. Of the few Dnmt3a-null HSCs that do differentiate, their progeny show incomplete methylation and partial repression of HSC genes.

References

    1. Attwood JT, Yung RL, Richardson BC. DNA methylation and the regulation of gene transcription. Cell. Mol. Life Sci. 2002;59:241–257. - PMC - PubMed
    1. Okano M, Xie S, Li E. Cloning and characterization of a family of novel mammalian DNA (cytosine-5) methyltransferases. Nat. Genet. 1998;19:219–220. - PubMed
    1. Okano M, Bell DW, Haber DA, Li E. DNA methyltransferases Dnmt3a and Dnmt3b are essential for de novo methylation and mammalian development. Cell. 1999;99:247–257. - PubMed
    1. Lei H, et al. De novo DNA cytosine methyltransferase activities in mouse embryonic stem cells. Development. 1996;122:3195–3205. - PubMed
    1. Chen T, Ueda Y, Dodge JE, Wang Z, Li E. Establishment and maintenance of genomic methylation patterns in mouse embryonic stem cells by Dnmt3a and Dnmt3b. Mol. Cell. Biol. 2003;23:5594–5605. - PMC - PubMed

Publication types

Substances

Associated data