

Bayesian localization microscopy reveals nanoscale podosome dynamics
- PMID: 22138825
- PMCID: PMC3272474
- DOI: 10.1038/nmeth.1812
Bayesian localization microscopy reveals nanoscale podosome dynamics
Abstract
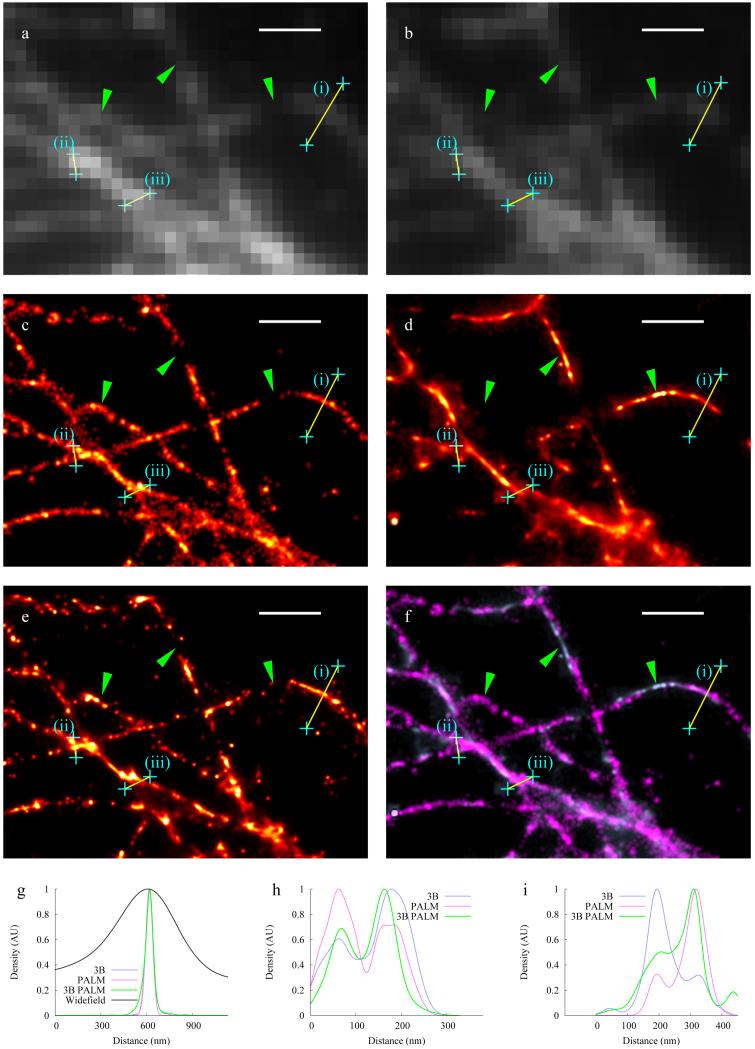
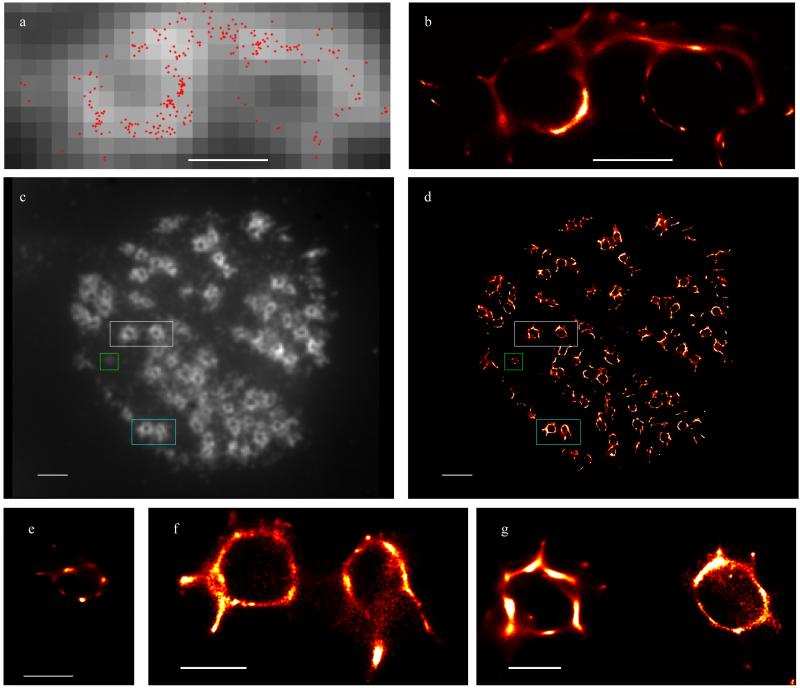
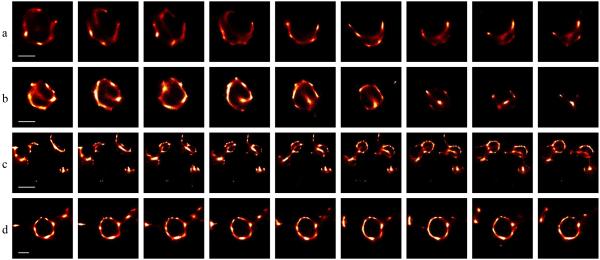
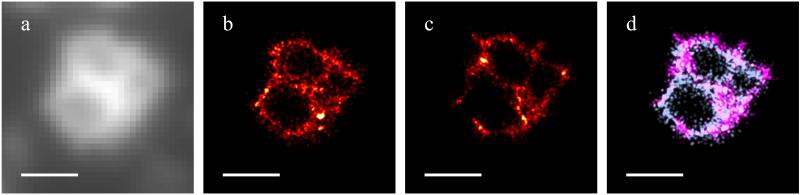
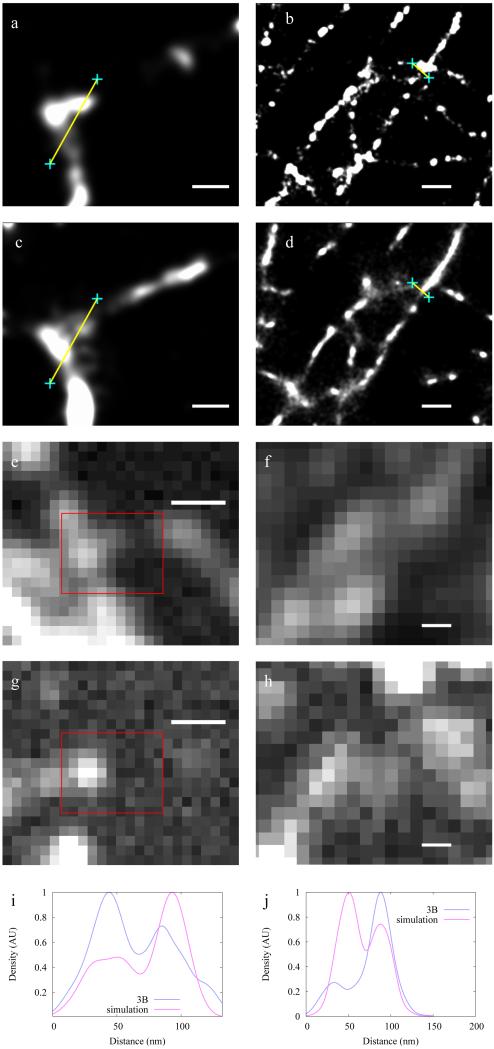
We describe a localization microscopy analysis method that is able to extract results in live cells using standard fluorescent proteins and xenon arc lamp illumination. Our Bayesian analysis of the blinking and bleaching (3B analysis) method models the entire dataset simultaneously as being generated by a number of fluorophores that may or may not be emitting light at any given time. The resulting technique allows many overlapping fluorophores in each frame and unifies the analysis of the localization from blinking and bleaching events. By modeling the entire dataset, we were able to use each reappearance of a fluorophore to improve the localization accuracy. The high performance of this technique allowed us to reveal the nanoscale dynamics of podosome formation and dissociation throughout an entire cell with a resolution of 50 nm on a 4-s timescale.
Figures

Comment in
-
Microscopy. Easing access to the nanoscale.Nat Rev Mol Cell Biol. 2011 Dec 22;13(1):6. doi: 10.1038/nrm3259. Nat Rev Mol Cell Biol. 2011. PMID: 22189422 No abstract available.
-
Super resolution for common probes and common microscopes.Nat Methods. 2012 Jan 30;9(2):139, 141. doi: 10.1038/nmeth.1863. Nat Methods. 2012. PMID: 22290184 Free PMC article.
Similar articles
-
Molecular Counting with Localization Microscopy: A Bayesian Estimate Based on Fluorophore Statistics.Biophys J. 2017 May 9;112(9):1777-1785. doi: 10.1016/j.bpj.2017.03.020. Biophys J. 2017. PMID: 28494949 Free PMC article.
-
Bayesian localization microscopy based on intensity distribution of fluorophores.Protein Cell. 2015 Mar;6(3):211-20. doi: 10.1007/s13238-015-0133-9. Epub 2015 Feb 12. Protein Cell. 2015. PMID: 25672498 Free PMC article.
-
Efficient super-resolution volumetric imaging by radial fluctuation Bayesian analysis light-sheet microscopy.J Biophotonics. 2020 Aug;13(8):e201960242. doi: 10.1002/jbio.201960242. Epub 2020 Jun 4. J Biophotonics. 2020. PMID: 32314491
-
Imaging cells at the nanoscale.Int J Biochem Cell Biol. 2013 Aug;45(8):1669-78. doi: 10.1016/j.biocel.2013.05.010. Epub 2013 May 18. Int J Biochem Cell Biol. 2013. PMID: 23688552 Review.
-
Nanoscopy for nanoscience: how super-resolution microscopy extends imaging for nanotechnology.Wiley Interdiscip Rev Nanomed Nanobiotechnol. 2015 May-Jun;7(3):266-81. doi: 10.1002/wnan.1300. Epub 2014 Oct 9. Wiley Interdiscip Rev Nanomed Nanobiotechnol. 2015. PMID: 25298332 Review.
Cited by
-
Simple super-resolution live-cell imaging based on diffusion-assisted Förster resonance energy transfer.Sci Rep. 2013;3:1208. doi: 10.1038/srep01208. Epub 2013 Feb 4. Sci Rep. 2013. PMID: 23383376 Free PMC article.
-
Fluorescence localization microscopy: The transition from concept to biological research tool.Commun Integr Biol. 2012 Jul 1;5(4):345-9. doi: 10.4161/cib.20348. Commun Integr Biol. 2012. PMID: 23060958 Free PMC article.
-
Super-resolution imaging of live sperm reveals dynamic changes of the actin cytoskeleton during acrosomal exocytosis.J Cell Sci. 2018 Nov 8;131(21):jcs218958. doi: 10.1242/jcs.218958. J Cell Sci. 2018. PMID: 30301778 Free PMC article.
-
Three-Dimensional Localization of Single Molecules for Super-Resolution Imaging and Single-Particle Tracking.Chem Rev. 2017 Jun 14;117(11):7244-7275. doi: 10.1021/acs.chemrev.6b00629. Epub 2017 Feb 2. Chem Rev. 2017. PMID: 28151646 Free PMC article. Review.
-
Molecular Counting with Localization Microscopy: A Bayesian Estimate Based on Fluorophore Statistics.Biophys J. 2017 May 9;112(9):1777-1785. doi: 10.1016/j.bpj.2017.03.020. Biophys J. 2017. PMID: 28494949 Free PMC article.
References
-
- Heintzmann R, Ficz G. Breaking the resolution limit in light microscopy. Methods in Cell Biology. 2007;81:561–580. - PubMed
-
- Hell SW. Microscopy and its focal switch. Nat. Methods. 2009;6:24–32. - PubMed
-
- Heintzmann R, Jovin TM, Cremer C. Saturated patterned excitation microscopy - a concept for optical resolution improvement. J. Opt. Soc. Am. A. 2002;19:1599–1609. - PubMed
-
- Betzig E, et al. Imaging intracellular fluorescent proteins at nanometer resolution. Science. 2006;313:1642–1645. - PubMed
Publication types
MeSH terms
Grants and funding
LinkOut - more resources
Full Text Sources
Other Literature Sources
