

Head-down posture induces PERG alterations in early glaucoma
- PMID: 22138883
- PMCID: PMC3296897
- DOI: 10.1097/IJG.0b013e318232973b
Head-down posture induces PERG alterations in early glaucoma
Abstract
Purpose: To probe susceptibility of retinal ganglion cells (RGC) to physiological stressors associated with moderate head-down body tilt in patients with suspicion of glaucoma or early manifest glaucoma (EMG).
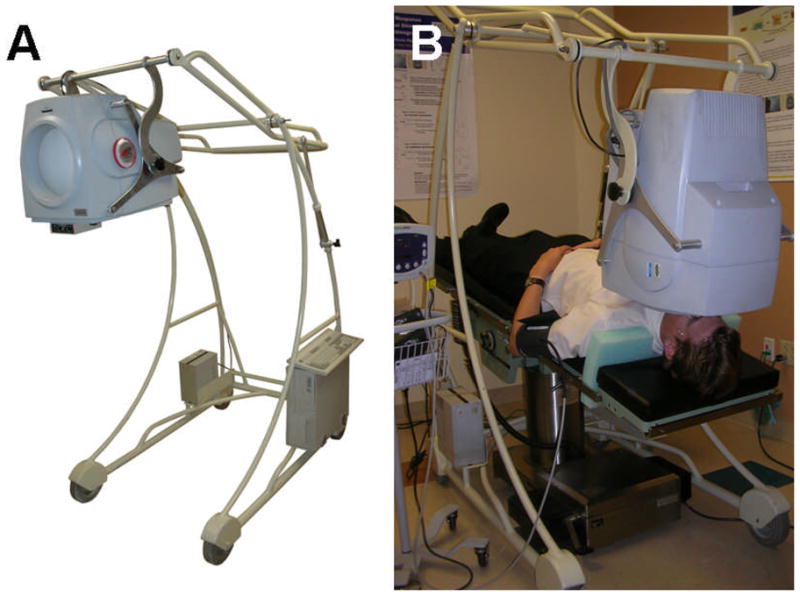
Methods: One hundred nine subjects with best corrected visual acuity (BCVA) ≥ 20/20 and no disease other than glaucoma [glaucoma suspects (GS)=79, EMG=14, normal controls (NC)=16 and comparable age range were tested. Noncontact intraocular pressure (IOP), pattern electroretinogram (PERG), and brachial blood pressure/heart rate measurements were performed in 3 consecutive conditions (∼0038 min apart): seated (baseline), -10-degree whole body head-down tilt (HDT), and seated again (recovery). PERG amplitude and latency, IOP, and systolic/diastolic blood pressures, heart rate, calculated mean central retinal artery pressure, ocular perfusion pressure, and systolic/diastolic perfusion pressures were evaluated.
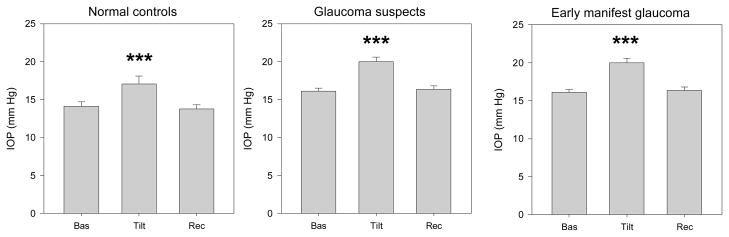
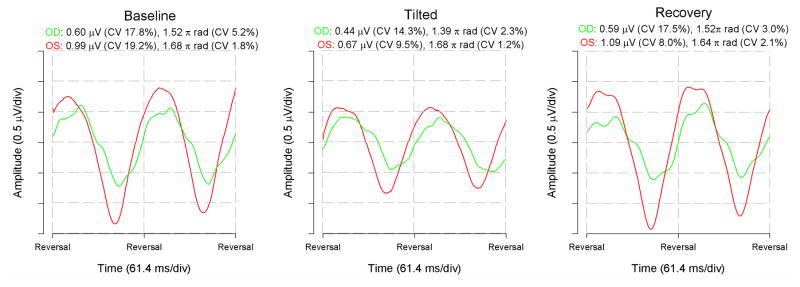
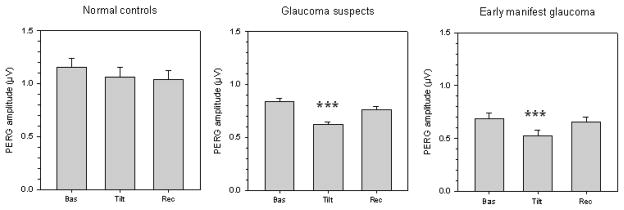
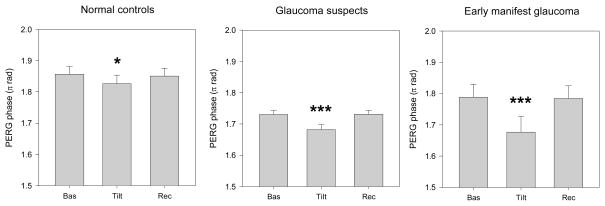
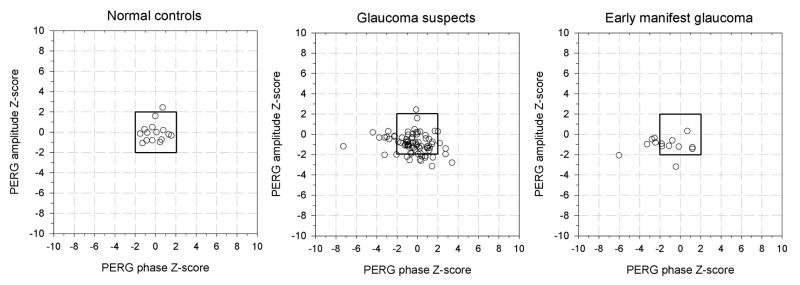
Results: During HDT, IOP significantly (P<0.001) increased in all groups approximately to the same extent (approximately 20%). PERG amplitude did not change in NC but decreased significantly (P<0.001) in patients (GS, -25%, EMG -23%). PERG phase become delayed in NC (-1.6%, P=0.04) but more so in patients (GS, -2.7%, P<0.001; EMG, -6.0%, P<0.001). The proportion of patients with PERG alterations significantly (P<0.05) exceeding those occurring in age-adjusted and baseline-adjusted NC were, GS: amplitude 20%, phase 15%; EMG: amplitude 14%, phase 50%. All measures recovered baseline values after HDT.
Conclusions: Moderate HDT induces temporary worsening of RGC function in a subpopulation of GS and EMG patients. This noninvasive protocol may help disclose abnormal susceptibility of RGCs in a subset of the patients at risk of glaucoma.
Figures
Similar articles
-
Head-down Posture in Glaucoma Suspects Induces Changes in IOP, Systemic Pressure, and PERG That Predict Future Loss of Optic Nerve Tissue.J Glaucoma. 2017 May;26(5):459-465. doi: 10.1097/IJG.0000000000000648. J Glaucoma. 2017. PMID: 28263259 Free PMC article.
-
Pattern electroretinogram abnormality and glaucoma.Ophthalmology. 2005 Jan;112(1):10-9. doi: 10.1016/j.ophtha.2004.07.018. Ophthalmology. 2005. PMID: 15629814 Free PMC article.
-
The relationship between retinal ganglion cell function and retinal nerve fiber thickness in early glaucoma.Invest Ophthalmol Vis Sci. 2006 Sep;47(9):3904-11. doi: 10.1167/iovs.06-0161. Invest Ophthalmol Vis Sci. 2006. PMID: 16936103 Free PMC article.
-
Electrophysiological assessment of retinal ganglion cell function.Exp Eye Res. 2015 Dec;141:164-70. doi: 10.1016/j.exer.2015.05.008. Epub 2015 May 18. Exp Eye Res. 2015. PMID: 25998495 Free PMC article. Review.
-
Pattern electroretinogram in glaucoma.Curr Opin Ophthalmol. 2006 Apr;17(2):196-202. doi: 10.1097/01.icu.0000193082.44938.3c. Curr Opin Ophthalmol. 2006. PMID: 16552256 Free PMC article. Review.
Cited by
-
Modeling Retinal Ganglion Cell Dysfunction in Optic Neuropathies.Cells. 2021 Jun 5;10(6):1398. doi: 10.3390/cells10061398. Cells. 2021. PMID: 34198840 Free PMC article. Review.
-
Non-invasive Assessment of Central Retinal Artery Pressure: Age and Posture-dependent Changes.Curr Eye Res. 2021 Jan;46(1):135-139. doi: 10.1080/02713683.2020.1772833. Epub 2020 Jun 4. Curr Eye Res. 2021. PMID: 32441142 Free PMC article.
-
Head-down Posture in Glaucoma Suspects Induces Changes in IOP, Systemic Pressure, and PERG That Predict Future Loss of Optic Nerve Tissue.J Glaucoma. 2017 May;26(5):459-465. doi: 10.1097/IJG.0000000000000648. J Glaucoma. 2017. PMID: 28263259 Free PMC article.
-
New steps of robot-assisted radical prostatectomy using the extraperitoneal approach: a propensity-score matched comparison between extraperitoneal and transperitoneal approach in Japanese patients.BMC Urol. 2017 Nov 21;17(1):106. doi: 10.1186/s12894-017-0298-z. BMC Urol. 2017. PMID: 29162068 Free PMC article. Clinical Trial.
-
Acute effects of posture on intraocular pressure.PLoS One. 2020 Feb 6;15(2):e0226915. doi: 10.1371/journal.pone.0226915. eCollection 2020. PLoS One. 2020. PMID: 32027692 Free PMC article.
References
-
- Maffei L, Fiorentini A. Electroretinographic responses to alternating gratings before and after section of the optic nerve. Science. 1981;211:953–955. - PubMed
-
- Zrenner E. The physiological basis of the pattern electroretinogram. In: Osborne N, Chader G, editors. Progress in Retinal Research. Oxford: Pergamon Press; 1990. pp. 427–464.
-
- Viswanathan S, Frishman LJ, Robson JG. The uniform field and pattern ERG in macaques with experimental glaucoma: removal of spiking activity. Invest Ophthalmol Vis Sci. 2000;41:2797–2810. - PubMed
-
- Holder GE. Pattern electroretinography (PERG) and an integrated approach to visual pathway diagnosis. Prog Retin Eye Res. 2001;20:531–561. - PubMed
Publication types
MeSH terms
Grants and funding
LinkOut - more resources
Full Text Sources
Other Literature Sources
Medical
