Review
. 2013 Jan;77(1):74-97.
doi: 10.1007/s00426-011-0392-x. Epub 2011 Dec 3.

Neural representations of faces and limbs neighbor in human high-level visual cortex: evidence for a new organization principle

Affiliations
Review

Neural representations of faces and limbs neighbor in human high-level visual cortex: evidence for a new organization principle

Kevin S Weiner et al. Psychol Res. 2013 Jan.

Abstract

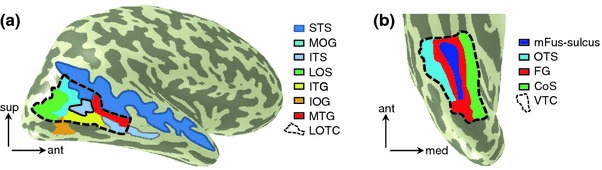
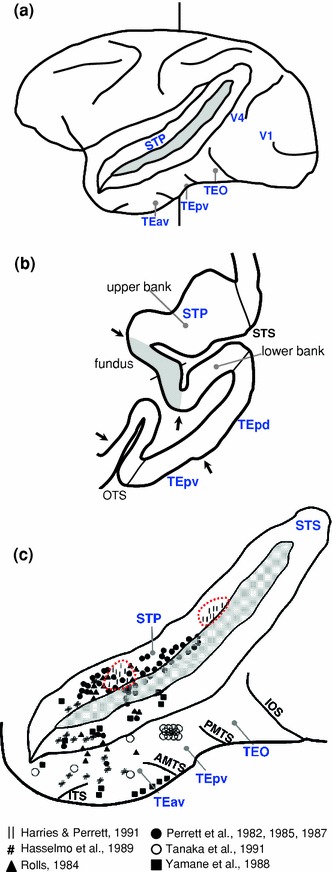
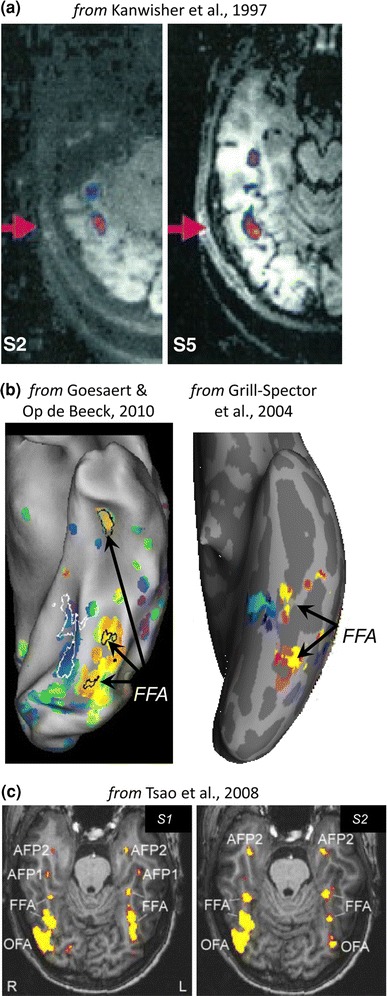
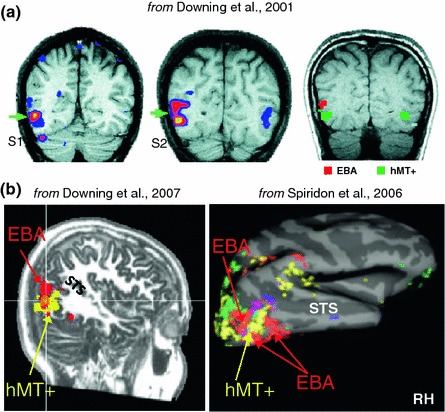
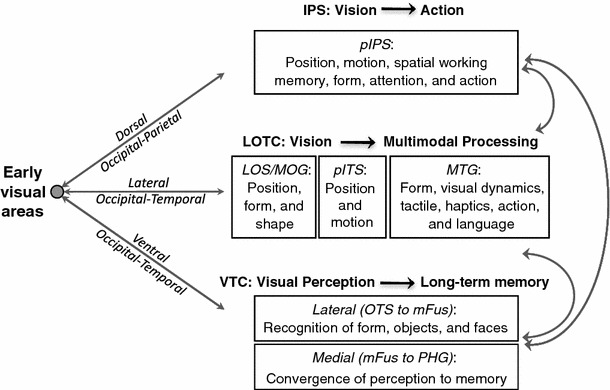
Neurophysiology and optical imaging studies in monkeys and functional magnetic resonance imaging (fMRI) studies in both monkeys and humans have localized clustered neural responses in inferotemporal cortex selective for images of biologically relevant categories, such as faces and limbs. Using higher resolution (1.5 mm voxels) fMRI scanning methods than past studies (3-5 mm voxels), we recently reported a network of multiple face- and limb-selective regions that neighbor one another in human ventral temporal cortex (Weiner and Grill-Spector, Neuroimage, 52(4):1559-1573, 2010) and lateral occipitotemporal cortex (Weiner and Grill-Spector, Neuroimage, 56(4):2183-2199, 2011). Here, we expand on three basic organization principles of high-level visual cortex revealed by these findings: (1) consistency in the anatomical location of functional regions, (2) preserved spatial relationship among functional regions, and (3) a topographic organization of face- and limb-selective regions in adjacent and alternating clusters. We highlight the implications of this structure in comparing functional brain organization between typical and atypical populations. We conclude with a new model of high-level visual cortex consisting of ventral, lateral, and dorsal components, where multimodal processing related to vision, action, haptics, and language converges in the lateral pathway.


Figures

Fig. 1
Fig. 1
Anatomical delineations of lateral occipitotemporal cortex (LOTC) and ventral temporal cortex (VTC). a LOTC (dashed outline) is the portion of cortex bounded by the lateral occipital sulcus (LOS), inferotemporal gyrus (ITG), middle temporal gyrus (MTG), and posterior superior temporal sulcus (STS). b VTC (dashed outline) is bounded by the occipitotemporal sulcus (OTS), middle of the fusiform gyrus just anterior to the mid‐fusiform sulcus (FG and mFus‐sulcus), collateral sulcus (CoS), and the posterior fusiform gyrus
Fig. 2
Fig. 2
Schematic depicting the location of face‐selective cells in monkey superior temporal sulcus (STS) and inferotemporal (IT) cortex. a Top Lateral view of a macaque brain with the fundus of the STS unfolded and shaded in gray. Approximate locations of visual areas V1 and V4 are indicated, in addition to the superior temporal polysensory area (STP) in the upper bank of the STS, as well as IT areas TEO and the posterior and anterior ventral subdivisions of TE—TEpv and TEav. b Example coronal section illustrating the relationship between the upper bank, fundus, and lower bank of the STS where face cells have commonly been found. Location of the section indicated by vertical line in the lateral view in a. Early studies from Gross and colleagues typically recorded from the lower bank of the STS (Gross et al., , ; Desimone et al., 1984), while the early studies from Perrett and Rolls recorded from the upper bank (Perrett et al., , , 1985; Rolls, ; Baylis et al., 1987). Area TPO mentioned in the text is a cytoarchitechtonic subdivision of the upper bank, while areas TEa and TEm are adjacent subdivisions of the lower bank (Seltzer and Pandya, ; Baylis et al., 1987). Arrows indicate boundaries between cortical areas. Solid lines indicate lips and fundi of the sulci. Image adapted from Saleem et al., . c The superior temporal sulcus has been enlarged from the image in a in order to illustrate the different recording sites from numerous studies illustrating face‐selective cells throughout STS and IT cortex. Dotted red outline indicates the clusters of cells identified by Harries and Perrett (1991). Image adapted from Perrett et al., with permission from authors
Fig. 3
Fig. 3
The many faces of the FFA. Researchers identify more than one region on the fusiform, but typically refer to them all as the FFA because there has been no established criteria for accurate parcellation. a Two example subjects from Kanwisher et al., (1997). There is extensive variability in the location of the labeled FFA (defined from faces > objects, indicated by arrows) in both the superior–inferior dimension, as well as the anterior–posterior dimension. This difference is hard to see with one axial slice. b Left Goesaert and Op de Beeck (2010) refer to three anatomically distinct face‐selective patches as the FFA (defined from faces > hands, torsos, buildings, and skyscrapers). Right Grill‐Spector et al., (2004) show two anatomically segregated regions and label them the FFA (defined from faces > objects). c Tsao et al., report two anterior temporal face‐selective patches, AFP1 and AFP2 (defined from faces > objects), but still label two similarly separate face‐selective regions on the fusiform as the FFA. Images adapted with permission from authors
Fig. 4
Fig. 4
The many faces of the EBA. a Three example subjects from Downing et al., (2001). The combination of coronal volume‐based or inplane visualizations with large voxels and spatial smoothing obstructs the view of the underlying anatomical structures, as well as the precise spatial organization of the EBA relative to hMT+. b The spatial relationship between the EBA and hMT+ changes with different visualizations. On the sagittal slice (left) the EBA (red) is largely posterior and overlaps with hMT+ (yellow; from Downing et al., 2007), while on the cortical surface (right) the EBA (red) appears to surround hMT+ (yellow) in a ring‐like structure (from Spiridon et al., 2006). Images adapted with permission from authors
Fig. 5
Fig. 5
A problem with volume‐based data visualizations is reconciled using cortical surface visualizations in single subjects. Left Example axial slice from a single subject. Middle Zoomed portion surrounding the posterior inferotemporal sulcus indicated by the dotted red outline. Two regions of interest (green, red) are illustrated in different anatomical locations that would appear to be one contiguous region using large functional voxels (3–5 mm on a side) and spatial smoothing (e.g. Figs. 3, 4). Notably, neurons close to one another in volume space due to the sulcal and gyral folding patterns may perform different functions (e.g. Fig. 9). Right Inflated cortical surface illustrating the precise anatomical locations of these ROIs. The distance on the gray matter between these two ROIs is 15 mm rather than 5 mm in volume space
Fig. 6
Fig. 6
Face‐ and limb‐selective regions alternate in ventral temporal cortex (VTC) and lateral occipitotemporal cortex (LOTC). Face‐selective and limb‐selective activations on the inflated right cortical surfaces of three example subjects. In each inset, black rectangles indicate the imaged region of VTC and LOTC in these higher resolution functional scans (1.5 × 1.5 × 3 mm voxels). hMT+ is indicated by the dotted black outline. In LOTC (superior portion of each image), face‐ and limb‐selective regions radiate around hMT+ in an alternating fashion. In VTC (inferior portion of each image), this alternation among face‐ and limb‐selective regions continues. For clarity voxels responding comparably to both faces and limbs are not colored separately. Acronyms: OTS: occipitotemporal sulcus; ITS: inferotemporal sulcus; STS: superior temporal sulcus
Fig. 7
Fig. 7
Stable response amplitudes to object categories across experiments. Left Zoomed portion of an inflated right hemisphere schematically illustrating the locations of four ROIs in ventral temporal cortex: a pFus‐faces, b OTS‐limbs, c mFus disk ROI, and d mFus‐faces. All ROIs were defined functionally from localizer scans except for the disk ROI, which was defined as a 10 mm diameter disk on the cortical surface in the anatomical extent separating mFus‐faces and pFus‐faces. ROIs were defined from one session and response amplitudes were extracted from three independent experiments either from the same day (event‐related) or five months later (two block design experiments). The event‐related experiment used four categories, while the other experiments used six. Responses are relative to a fixation baseline and averaged across hemispheres and subjects. Error bars indicate SEMs across subjects. Adapted from Weiner and Grill‐Spector (2010)
Fig. 8
Fig. 8
Alternation of face‐ and limb‐selective regions is also evident using larger functional voxels and inplane visualizations, but not with spatial smoothing. An example inplane slice from subject S3 acquired with voxels eight times as large (3.75 × 3.75 × 4 mm) as our HR‐fMRI scans. Left Face‐selective regions (red). Middle Face‐selective regions with limb‐selective regions (green), and their overlap (yellow). Labeling of face‐selective regions is possible using limb‐selective regions as a guide (and vice versa). Right With spatial smoothing and not restricting data to gray matter, however, mFus‐ and pFus‐faces merge to a single region, and OTS‐ and ITG‐limbs merge. The top rightmost image is smoothed with a 4 mm kernel and the bottom rightmost image is smoothed with an 8 mm kernel
Fig. 9
Fig. 9
Functional differences among VTC and LOTC activations that would be missed if regions were defined as FFA and EBA. a Difference in responses to blocks of nonrepeated compared to repeated images (fMRI‐adaptation level) averaged across categories and subjects. fMRI‐adaptation was significantly larger in mFus‐faces than pFus‐faces (* P < 0.03), illustrating functional differences between these ROIs (adapted from Fig. 3, Weiner et al., 2010). b Mean responses across subjects to limbs presented contralaterally versus ipsilaterally (contralateral bias) and limbs presented foveally versus contralaterally (foveal bias). The limb‐selective LOS/MOG illustrates a significantly greater contralateral bias than foveal bias (* P < 0.05), while the ITG and MTG do not (adapted from Weiner & Grill‐Spector, 2011). Error bars in both panels indicate SEMs across subjects
Fig. 10
Fig. 10
Summary schematic depicting the organization of face‐ and limb‐selective regions throughout high‐level visual cortex. Inset indicates the anatomical location of the summary schematic on the cortex. LOTC: Face‐ and limb‐selective regions radiate around the perimeter of hMT+, which can be further divided into MT and MST (Amano et al., 2009). Each of these face‐ and limb‐selective activations is situated in a different anatomical location where the spatial relationship among activations is preserved. Importantly, no face‐ or limb‐selective voxels are found in the center of hMT+ (which is also the location of the upper vertical meridian shared between MT and MST). VTC: This alternation of face‐ and limb‐selective regions extends ventrally where two face‐selective activations on the fusiform are separated by a limb‐selective region located in the OTS
Fig. 11
Fig. 11
A three stream model of high‐level visual cortex. The model is divided into three pathways, dorsal, lateral, and ventral, extending from early visual cortex. The parcellation of each pathway is guided by specific anatomical boundaries and functional differences, either visual or multimodal in nature. Gray arrows indicate interactions between pathways, while black arrows indicate transitions of function

Similar articles

Cited by

References

    1. Allison T, Ginter H, McCarthy G, Nobre AC, Puce A, Luby M, et al. Face recognition in human extrastriate cortex. Journal of Neurophysiology. 1994;71(2):821–825. - PubMed
    1. Allison T, McCarthy G, Nobre A, Puce A, Belger A. Human extrastriate visual cortex and the perception of faces, words, numbers, and colors. Cerebral Cortex. 1994;4(5):544–554. doi: 10.1093/cercor/4.5.544. - DOI - PubMed
    1. Amano K, Wandell BA, Dumoulin SO. Visual field maps, population receptive field sizes, and visual field coverage in the human MT+ complex. Journal of Neurophysiology. 2009;102(5):2704–2718. doi: 10.1152/jn.00102.2009. - DOI - PMC - PubMed
    1. Amedi A, Malach R, Hendler T, Peled S, Zohary E. Visuo-haptic object-related activation in the ventral visual pathway. Nature Neuroscience. 2001;4(3):324–330. doi: 10.1038/85201. - DOI - PubMed
    1. Andrews TJ, Schluppeck D, Homfray D, Matthews P, Blakemore C. Activity in the fusiform gyrus predicts conscious perception of Rubin’s vase-face illusion. Neuroimage. 2002;17(2):890–901. doi: 10.1006/nimg.2002.1243. - DOI - PubMed

Publication types